
Penerangan
Apakah LTtradingBox?
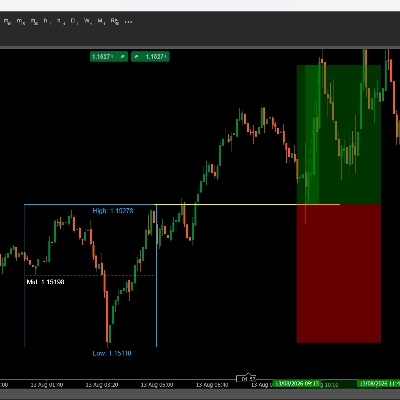
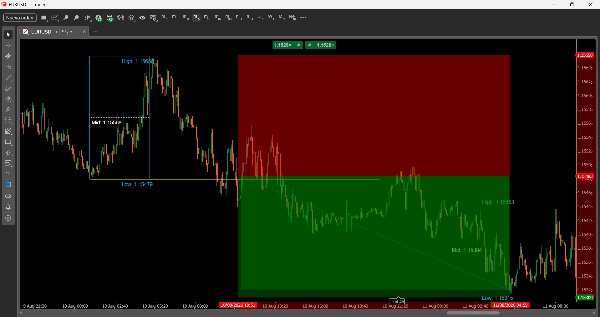
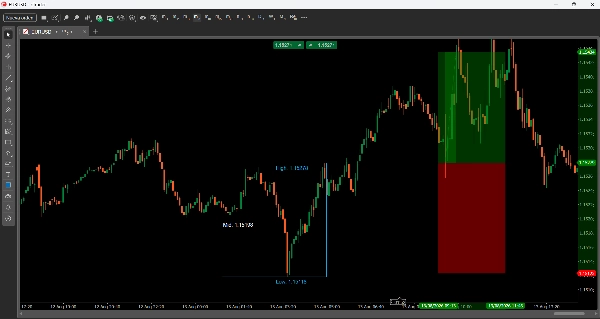
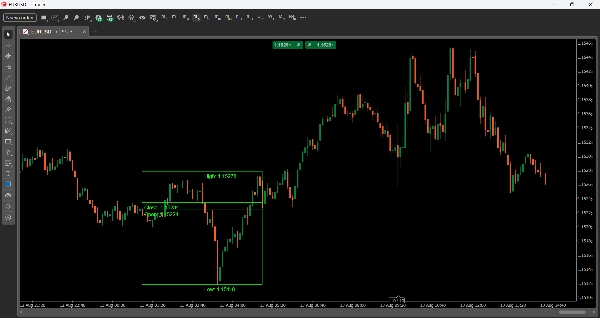
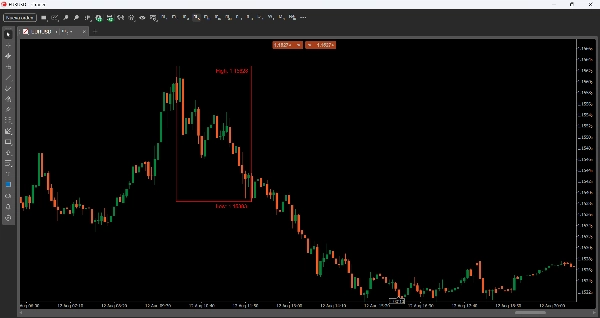
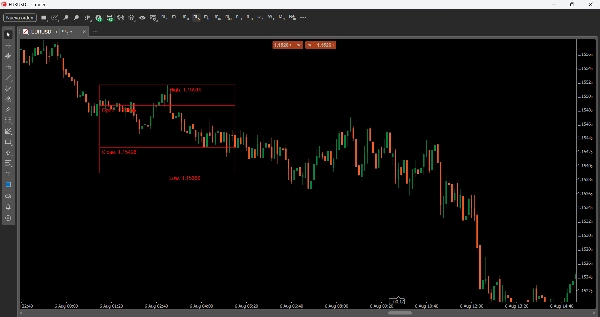
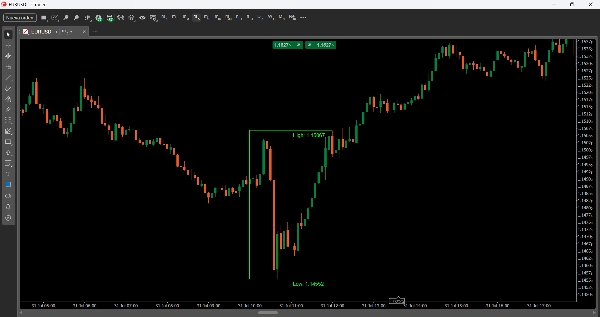
LTtradingBox menandakan julat harga secara visual (tinggi, rendah, buka, dan tutup) bagi tetingkap masa yang anda tetapkan — contohnya sesi London atau New York. Kotak ini secara automatik menukar warna berdasarkan hasil sesi tersebut: hijau jika ia ditutup bullish, merah jika ia ditutup bearish, kelabu jika neutral (atau warna yang anda pilih untuk setiap kes). Ia juga menambah garis rujukan (Harga Tengah, Masa Tengah) dan isian visual pilihan, membantu anda mengenal pasti zon kecairan, julat pengumpulan, dan tahap utama untuk berdagang dengan pantas.
Parameter
Tetapan Masa
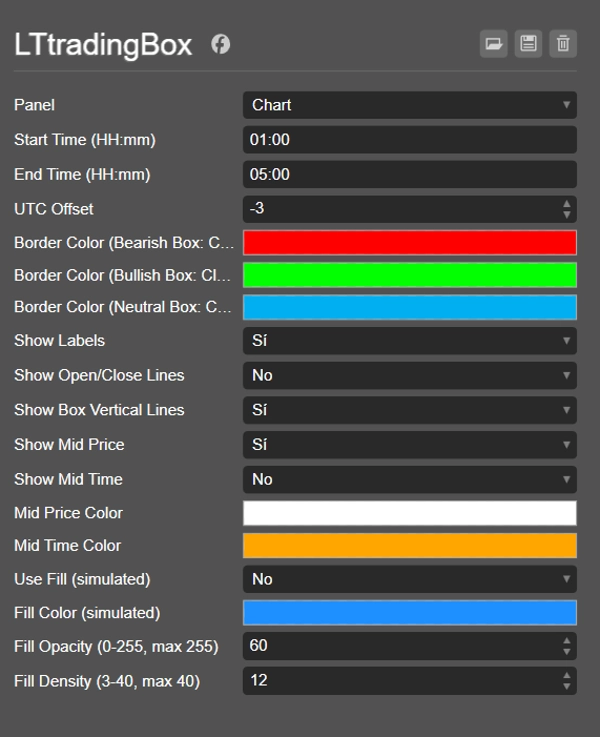
- Masa Mula (HH:mm) — Masa mula kotak (format 24 jam).
- Masa Tamat (HH:mm) — Masa tamat kotak.
- Pelarasan UTC — Penyesuaian masa supaya kotak selari dengan masa tempatan anda atau sesi yang anda ingin jejak (contoh: London, NY, Asia), tanpa mengira zon masa broker anda.
Warna
- Warna Sempadan (Kotak Bearish: Tutup < Buka) — Warna sempadan apabila kotak ditutup bearish.
- Warna Sempadan (Kotak Bullish: Tutup > Buka) — Warna sempadan apabila kotak ditutup bullish.
- Warna Sempadan (Kotak Neutral: Tutup == Buka) — Warna sempadan apabila tutup sama dengan buka.
Pilihan Paparan
- Tunjukkan Label — Menghidupkan atau mematikan label teks yang menunjukkan nilai Tinggi, Rendah, Buka, dan Tutup.
- Tunjukkan Garis Buka/Tutup — Melukis garis mendatar yang menandakan harga buka dan tutup dalam kotak.
- Tunjukkan Garis Menegak Kotak — Mengaktifkan segi empat penuh (4 sempadan); jika dimatikan, hanya garis Tinggi dan Rendah yang dipaparkan.
- Tunjukkan Harga Tengah — Melukis garis bertitik pada titik tengah antara Tinggi dan Rendah.
- Tunjukkan Masa Tengah — Melukis garis menegak pada titik tengah masa kotak.
- Warna Harga Tengah / Warna Masa Tengah — Warna yang boleh disesuaikan untuk garis tersebut.
Isian (isian visual)
- Gunakan Isian (disimulasikan) — Mengaktifkan isian disimulasikan di dalam kotak (menggunakan garis nipis bertindih).
- Warna Isian (disimulasikan) — Warna isian.
- Ketelusan Isian (0-255, maks 255) — Tahap ketelusan isian.
- Ketumpatan Isian (3-40, maks 40) — Bilangan garis yang digunakan untuk mensimulasikan isian (ketumpatan lebih tinggi = isian lebih padat).
Idea Perdagangan
- Breakout dan uji semula: tunggu harga memecah Tinggi atau Rendah kotak, kemudian kembali untuk menguji semula tahap itu sebagai sokongan/rintangan sebelum masuk mengikut arah breakout.
- Pembalikan di hujung ekstrem: jika harga menyentuh Tinggi atau Rendah kotak tanpa menembusi dengan kekuatan, ia mungkin menandakan penolakan dan pergerakan ke arah bertentangan kotak.
- Bias arah mengikut sesi: warna kotak memberi anda bias cepat (bullish/bearish/neutral) tentang bagaimana sesi itu bergerak, berguna untuk menyelaraskan kemasukan dalam sesi berikutnya.
- Harga Tengah sebagai magnet: titik tengah sering bertindak sebagai zon penyeimbangan semula — cari kemasukan apabila harga kembali ke Tengah selepas pergerakan impulsif yang kuat.
- Bandingkan kotak berturut-turut: kerana setiap kotak harian disimpan (melalui tag tarikh), anda boleh membandingkan julat dan bias beberapa sesi berturut-turut untuk mengenal pasti trend jangka pendek.
Ringkasan
Ringkasan AI
LTtradingBox is a customizable trading indicator that visually highlights the price range—high, low, open, and close—within any user-defined time window, such as a specific trading session. The indicator draws a colored box representing this range, automatically changing its border color to green for bullish closes, red for bearish closes, or gray for neutral, with customizable color options. It includes reference lines for the midpoint price and midpoint time, which can be displayed as dotted or vertical lines, aiding in identifying liquidity zones, accumulation areas, and key support/resistance levels.
Users can configure start and end times, apply a UTC offset to align with local or session times, and toggle display options such as labels for price points, open/close lines, full box borders, and visual fills with adjustable color, opacity, and density. The indicator supports trading strategies including breakout and retest of box boundaries, reversal signals at extremes, session-based directional bias, and using the midpoint as a rebalancing zone. It also allows comparison of consecutive session boxes to detect short-term trends. LTtradingBox is designed to assist traders in quickly identifying key levels and market structure within chosen timeframes.
Users can configure start and end times, apply a UTC offset to align with local or session times, and toggle display options such as labels for price points, open/close lines, full box borders, and visual fills with adjustable color, opacity, and density. The indicator supports trading strategies including breakout and retest of box boundaries, reversal signals at extremes, session-based directional bias, and using the midpoint as a rebalancing zone. It also allows comparison of consecutive session boxes to detect short-term trends. LTtradingBox is designed to assist traders in quickly identifying key levels and market structure within chosen timeframes.
Profil indikator
Kategori indikator
Sokongan & rintangan
Jenis output
Visualisasi
Keperluan data
Bar sahaja
Isyarat yang disokong
Terobosan
Pembalikan
Pecahan paras
Sentuhan paras
Ulasan pelanggan
0.0
Ulasan: 0
Ulasan pelanggan
Belum ada ulasan untuk produk ini. Anda sudah mencuba produk tersebut? Jadilah yang pertama untuk berkongsi pendapat anda!
Perbincangan
Soalan Lazim
Key Levels
Support & Resistance
Produk yang tersedia melalui cTrader Store, termasuk bot dagangan, indikator dan plugin, disediakan oleh pembangun pihak ketiga dan diberikan akses untuk tujuan maklumat dan teknikal sahaja. cTrader Store bukan broker dan tidak memberikan nasihat pelaburan, syor peribadi atau sebarang jaminan prestasi masa hadapan.


















Harga
Sejak 10/01/2025