
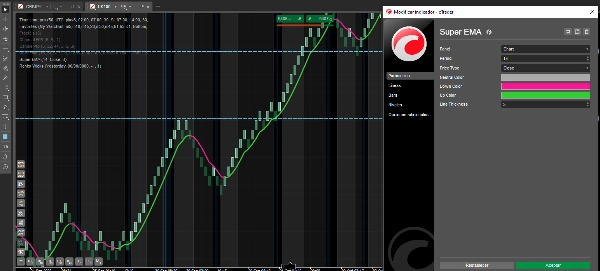
Super EMA
Indicador
Versión 1.0, Oct 2025
Windows, Mac
¿Cansado de medias móviles que se retrasan y no dan señales claras?
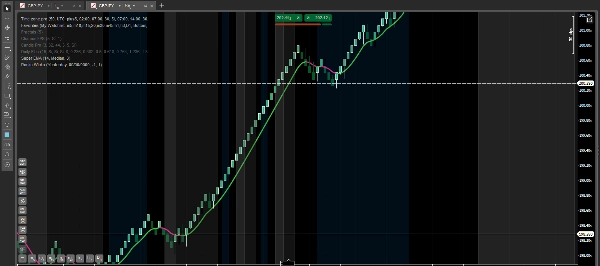
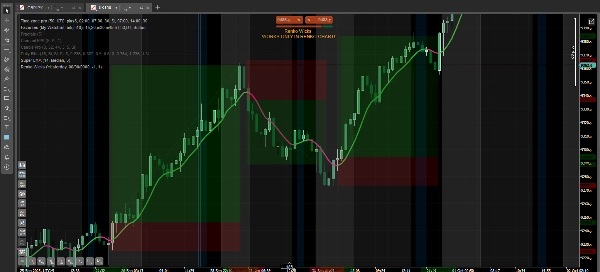
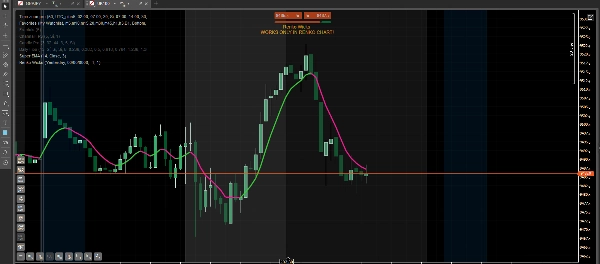
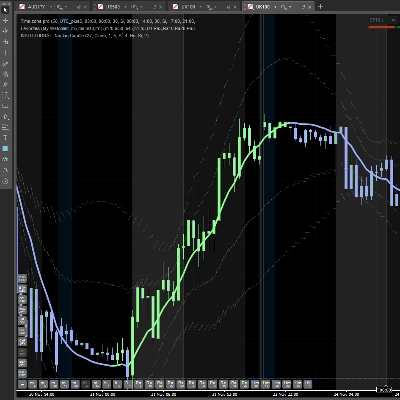
Super EMA colorea la tendencia en tiempo real para que puedas ver instantáneamente quién tiene el control:
- 🟩 Verde → impulso alcista
- 🟥 Rosa → presión bajista
Su doble suavizado elimina el ruido, dándote una línea limpia, reactiva y confiable para detectar cambios de dirección, filtrar entradas y aprovechar los movimientos con confianza.
Funciona en cualquier símbolo y marco temporal. Perfecto para scalpers, traders diarios y traders de swing que quieren una visión clara y sin complicaciones de la tendencia.
Perfil del indicador
0.0
Valoraciones: 0
Valoraciones de clientes
Este producto todavía no se ha valorado. ¿Ya lo ha probado? Sea el primero en informar a otros.
Forex
Signal
Indices
Crypto
Stocks
Los productos disponibles a través de cTrader Store, incluidos bots, indicadores y plugins para operar, son proporcionados por desarrolladores de terceros y están disponibles únicamente con fines informativos y de acceso técnico. cTrader Store no es un bróker, por lo que no proporciona asesoramiento de inversión, recomendaciones personales ni ninguna garantía de rentabilidad futura.


Puede interesarle


Desde 24/02/2025
13
Ventas
1.7K
Instalaciones gratis