Opis
Profesjonalna analiza wolumenu oparta na zakresie z inteligentnym obliczaniem delty świecy
Odkryj moc precyzyjnej analizy wolumenu dzięki RANGE DELTA CANDLE VOLUME PROFILE, najlepszymu wskaźnikowi profilu wolumenu opartego na zakresie dla cTrader. Zaprojektowany dla traderów potrzebujących elastycznej, dokładnej analizy wolumenu w niestandardowych zakresach czasowych, ten wskaźnik dostarcza wglądów na poziomie instytucjonalnym dzięki inteligentnemu obliczaniu delty na podstawie świec.
🎯 KLUCZOWE CECHY
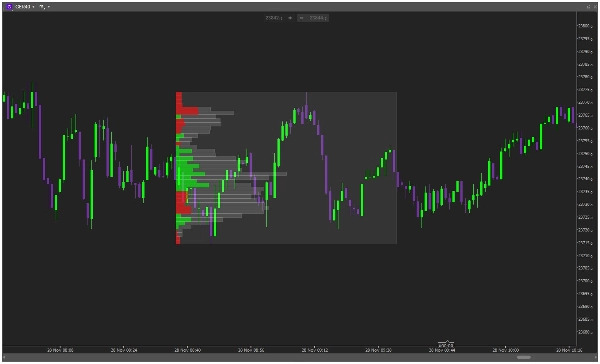
🏓 ELASTYCZNE USTAWIANIE ZAKRESU
- Używaj linii trendu do definiowania DOWOLNEGO niestandardowego zakresu czasowego
- Dynamiczne generowanie profilu pomiędzy wybranymi punktami
- Aktualizacje w czasie rzeczywistym w miarę rozwoju rynku
- Opcje kotwiczenia z lewej lub prawej strony
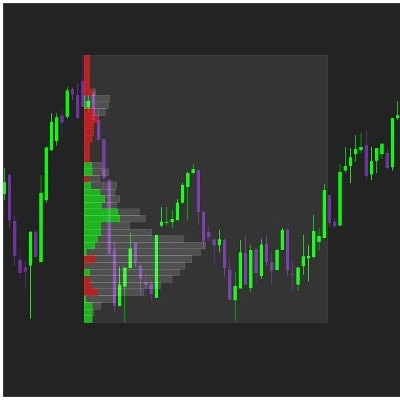
📊 INTELIGENTNA ANALIZA DELTY NA PODSTAWIE ŚWIEC
- Zaawansowane obliczanie delty oparte na kierunku świecy
- Zielone świece = Wolumen kupna | Czerwone świece = Wolumen sprzedaży
- Czysta, jednokolorowa wizualizacja na poziomie cenowym
- Natychmiastowa identyfikacja stref akumulacji/dystrybucji
🎨 W PEŁNI DOSTOSOWYWALNY WYŚWIETLACZ
- Regulowana liczba przedziałów/linii (5-100)
- Dostosowywana szerokość profilu (5-300% zakresu)
- Pełna kontrola kolorów dla wolumenu kupna/sprzedaży/całkowitego
- Ustawienia przezroczystości i krycia
⚡ PODWÓJNE TRYBY WYŚWIETLANIA
- Tryb Delty: Wizualizacja netto presji kupna/sprzedaży
- Tryb Wolumenu: Tradycyjny wyświetlacz profilu wolumenu
- Wybierz kotwiczenie z lewej lub prawej strony
🚀 DLACZEGO TRADERZY WYBIERAJĄ TEN WSKAŹNIK
"Elastyczność analizy dowolnego niestandardowego zakresu zmienia zasady gry. Idealny do analizy sesji i kluczowych ruchów rynkowych." - Profesjonalny Day Trader
"Wreszcie profil wolumenu oparty na zakresie, który naprawdę ma sens. Delta oparta na świecach jest niesamowicie dokładna." - Swing Trader
📈 IDEALNY DO
- Analizy Sesji - Analiza konkretnych sesji handlowych (Londyn, NY, Azja)
- Trading oparty na wydarzeniach - Badanie wolumenu wokół wydarzeń i danych ekonomicznych
- Analizy technicznej - Potwierdzanie wsparć/oporów za pomocą walidacji wolumenu
- Struktury rynku - Identyfikacja obszarów wartości i luk wolumenowych
🛠 PROSTE W UŻYCIU
- Narysuj linię trendu między punktami początkowym i końcowym
- Obserwuj jak profil wolumenu generuje się automatycznie
- Analizuj rozkład delty w wybranym zakresie
- Handluj na poziomach i z wglądami potwierdzonymi wolumenem
🔧 SPECYFIKACJE TECHNICZNE
- Obliczenia i aktualizacje w czasie rzeczywistym
- Niskie zużycie zasobów
- Kompatybilny ze wszystkimi interwałami czasowymi
- Działa ze wszystkimi instrumentami handlowymi
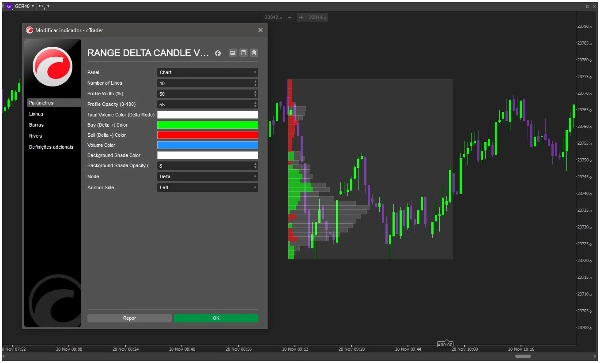
📋 OPCJE DOSTOSOWANIA
- Liczba przedziałów/linii
- Procentowa szerokość profilu
- Kontrola krycia (0-100%)
- Niestandardowe schematy kolorów
- Wybór strony kotwiczenia (lewa/prawa)
- Tryb wyświetlania (Delta/Wolumen)
🎯 PODNIEŚ SWOJĄ ANALIZĘ RYNKU JUŻ DZIŚ!
Dołącz do profesjonalnych traderów na całym świecie, którzy zrewolucjonizowali swoją analizę rynku dzięki RANGE DELTA CANDLE VOLUME PROFILE. Przestań używać sztywnych narzędzi o stałym zakresie i zacznij analizować wolumen dokładnie tam, gdzie tego potrzebujesz.
⭐ "Możliwość analizy niestandardowych zakresów z dokładnym obliczaniem delty całkowicie zmieniła moje podejście do struktury rynku. Niezbędne narzędzie!"
Dodaj RANGE DELTA CANDLE VOLUME PROFILE do swojej platformy cTrader już dziś i opanuj analizę wolumenu w każdych warunkach rynkowych!
🆚 DLACZEGO WYBRAĆ TO NARZĘDZIE ZAMIENIE NA INNE PROFILE WOLUMENU?
- ✅ Prawdziwa elastyczność - Analizuj DOWOLNY niestandardowy zakres czasowy
- ✅ Dokładna delta - Obliczenia oparte na świecach dla wiarygodnych wyników
- ✅ Profesjonalna wizualizacja - Czysty, instytucjonalny wyświetlacz
- ✅ Prawdziwe dostosowanie - Pełna kontrola nad wszystkimi aspektami wizualnymi
- ✅ Sprawdzona metodologia - Oparta na profesjonalnych zasadach tradingu
Zmień swoją analizę wykresów dzięki mocy elastycznego profilowania wolumenu opartego na zakresie!


