Açıklama
Çift Gücü (JPY) - Döviz Gücü Göstergesi
📊 Çift Gücü (JPY) Nedir?
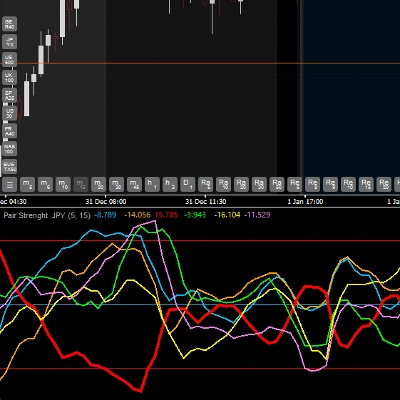
Çift Gücü (JPY), 6 ana para biriminin göreceli gücünü gerçek zamanlı olarak analiz eden ve karşılaştıran gelişmiş bir göstergedir: EUR, GBP, JPY, USD, AUD ve CAD. Her para biriminin momentumu ve gücünü ölçmek için True Strength Index (TSI) kullanır, böylece piyasada hangi para birimlerinin daha güçlü veya zayıf olduğunu belirlemenizi sağlar.
🎯 Ana Özellikler
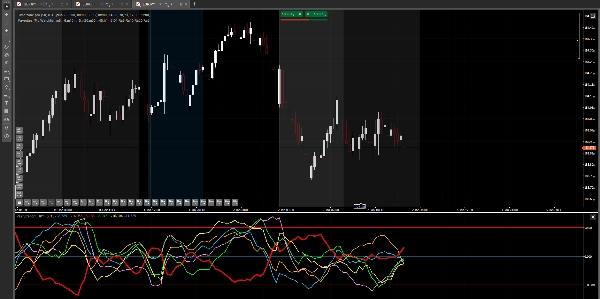
✅ Çoklu Döviz Analizi: Aynı anda 6 para birimini tek bir pencerede izleyin ✅ Trend Tespiti: Piyasadaki en güçlü ve en zayıf para birimlerini tespit edin ✅ Aşırı Alım/Aşırı Satım Sinyalleri: Aşırılıkları belirlemek için 50, 0 ve -50 seviyeleri ✅ İşlem Onayı: Göreceli gücü karşılaştırarak girişlerinizi doğrulamanıza yardımcı olur ✅ Görsel ve Net: Her para biriminin kolay tanımlama için kendi rengi vardır
💹 Uyumlu Çiftler
ÖNEMLİ: Bu gösterge 6 para biriminin gücünü analiz eder: EUR, GBP, JPY, USD, AUD ve CAD
Gösterge, SADECE JPY (Japon Yeni) içeren çiftlerle çalışır, yani:
- EURJPY (Euro / Yen)
- GBPJPY (Sterlin / Yen)
- USDJPY (Dolar / Yen)
- AUDJPY (Avustralya Doları / Yen)
- CADJPY (Kanada Doları / Yen)
⚠️ Brokerınızın bu 5 JPY çiftini sunması GEREKİR, göstergenin doğru çalışması için.
Şu çiftlerle çalışmaz:
- Altın, gümüş veya diğer metaller
- Hisse senedi endeksleri
- Kripto paralar
- JPY içermeyen çiftler (örneğin EURUSD, GBPUSD vb.)
Göstergiyi yukarıda belirtilen 5 çiftin herhangi birinin grafiğine uygulayabilirsiniz.
📈 Göstergenin Kullanımı
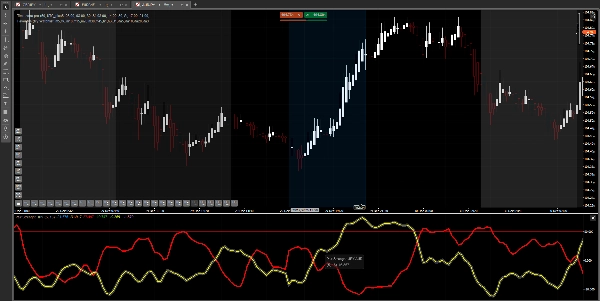
Çizgi Yorumlama:
Her renkli çizgi bir para biriminin gücünü temsil eder:
- Çizgi yukarı (pozitif değerler): Para birimi GÜÇLÜDÜR
- Çizgi aşağı (negatif değerler): Para birimi ZAYIFTIR
- Çizgi kesişmeleri: Para birimleri arasındaki göreceli güç değişimi
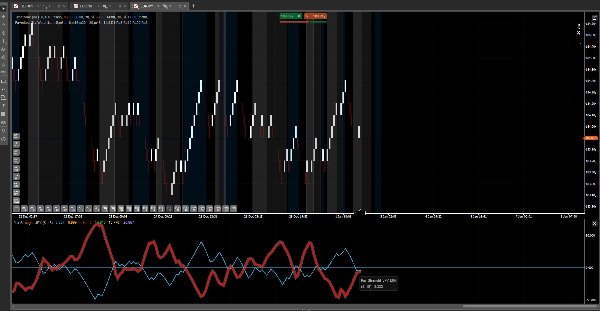
Ana Seviyeler:
- Seviye 50: Aşırı alım bölgesi - Para birimi çok güçlü olabilir ve dönüşe yakın olabilir
- Seviye 0: Nötr çizgi - Güç ve zayıflık dengesi
- Seviye -50: Aşırı satım bölgesi - Para birimi çok zayıf olabilir ve dönüşe yakın olabilir
Temel Strateji:
- EN GÜÇLÜ para birimini belirleyin (en yüksek çizgi)
- EN ZAYIF para birimini belirleyin (en düşük çizgi)
- Her ikisini birleştirerek çift üzerinde işlem yapın (örnek: EUR güçlü ve JPY zayıf ise → EURJPY satın alın)
- Seviyelerle onaylayın: Güçlü para birimi +50 seviyesindeyken alım yapmaktan veya zayıf olan -50 seviyesindeyken satış yapmaktan kaçının
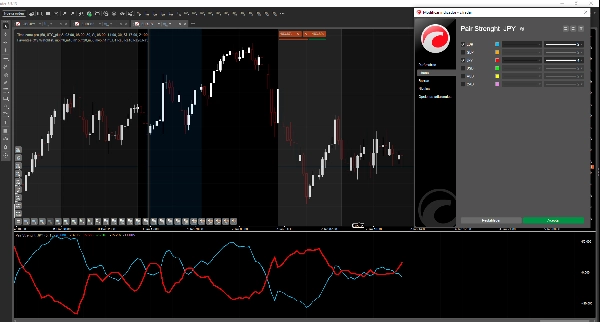
⚙️ Ayarlanabilir Parametreler
- Hızlı Periyot (Varsayılan: 5): TSI'nin hızlı periyodu - daha düşük değerler = daha hassas
- Yavaş Periyot (Varsayılan: 15): TSI'nin yavaş periyodu - daha yüksek değerler = daha yumuşak
Varsayılan değerler çoğu durum için uygundur. Ticaret tarzınıza göre ayarlayın.
🔮 Gelecek Güncellemeler
Kullanıcı tepkisi ve geri bildirimlere bağlı olarak gelecekte daha fazla döviz çifti (NZD, CHF vb.) ekleme olasılığını değerlendiriyoruz. Ancak bu garanti edilmez ve göstergenin performansı ile piyasa talebine bağlı olacaktır.
💡 Kullanım İpuçları
✓ Ana stratejinizle birlikte kullanın, tek başına sistem olarak değil ✓ Fiyat hareketi analizi ve destek/direnç seviyeleri ile birleştirin ✓ Canlı işlem öncesi demo hesapta pratik yapın ✓ Tüm sinyaller kazanan değildir - uygun risk yönetimi uygulayın ✓ En iyi M15 zaman dilimleri ve üzerindedir
📞 Destek
Gösterge kurulumu veya kullanımı hakkında sorularınız varsa, bizimle iletişime geçin.
Son Not: Bu gösterge bir analiz aracıdır. Ticaret başarısı risk yönetimi, psikoloji ve deneyim gibi birçok faktöre bağlıdır.
Özet
This tool works exclusively with currency pairs that include the Japanese Yen (JPY), specifically EURJPY, GBPJPY, USDJPY, AUDJPY, and CADJPY. It does not support metals, stock indices, cryptocurrencies, or pairs without JPY. Users apply the indicator on any of the five JPY pairs to monitor multi-currency strength simultaneously in one window.
Adjustable parameters include the fast and slow periods of the TSI for sensitivity and smoothing. The indicator aids in trend identification, overbought/oversold signal detection, and trade confirmation by comparing relative currency strength. It is recommended for use alongside other analysis methods and on timeframes of 15 minutes or higher.
Müşteri değerlendirmeleri
5 | 100 % | |
4 | 0 % | |
3 | 0 % | |
2 | 0 % | |
1 | 0 % |


