
Opis
3-słupkowe odwrócenie
📊 CO TO JEST?
3-Bar Reversal to wskaźnik techniczny, który identyfikuje konkretne wzorce odwrócenia utworzone przez dokładnie trzy kolejne świece. Ten klasyczny wzór sygnalizuje potencjalne zmiany kierunku ceny poprzez wyraźną strukturę wizualną: świecę trendu, świecę wyczerpania i świecę odwrócenia.
🎯 DO CZEGO TO SŁUŻY?
Ten wskaźnik pomaga traderom w:
- Wykrywaniu byczych i niedźwiedzich odwróceń z 3-świecową strukturą
- Filtrowaniu fałszywych sygnałów poprzez konfigurowalne potwierdzenie trendu
- Identyfikowaniu stref wsparcia i oporu na podstawie potwierdzonych wzorców
- Wizualizacji okazji handlowych za pomocą intuicyjnych znaczników na wykresie
- Handlu odwróceniami o wysokim prawdopodobieństwie na dowolnym interwale czasowym
🔍 JAK TO DZIAŁA?
Wzór byczy (3-słupkowe bycze odwrócenie)
Struktura trzech świec:
- Świeca 1 (niedźwiedzia): Zamknięcie poniżej otwarcia - potwierdza presję sprzedaży
- Świeca 2 (wyczerpanie niedźwiedzie): Tworzy nowe minima ORAZ nowe maksima poniżej świecy 1, z niedźwiedzim zamknięciem - sygnał kapitulacji ⚠️
- Świeca 3 (bycze odwrócenie): Zamknięcie powyżej otwarcia ORAZ maksimum powyżej maksimum świecy 1 - potwierdza zmianę kontroli ✅
Wzór niedźwiedzi (3-słupkowe niedźwiedzie odwrócenie)
Struktura odwrotna:
- Świeca 1 (bycza): Zamknięcie powyżej otwarcia - potwierdza presję kupna
- Świeca 2 (rozszerzenie bycze): Tworzy nowe maksima ORAZ nowe minima powyżej świecy 1, z byczym zamknięciem - sygnał nadmiernego rozszerzenia ⚠️
- Świeca 3 (niedźwiedzie odwrócenie): Zamknięcie poniżej otwarcia ORAZ minimum poniżej minimum świecy 1 - potwierdza zmianę kontroli ✅
System zarządzania wizualnego (maszyna stanów)
Wskaźnik przetwarza każdy wzór w trzech kolejnych fazach:
FAZA 1 - WYKRYWANIE WZORU: 🔍
- Zidentyfikowana jest kompletna struktura 3 świec
- Pojawia się wskaźnik trójkąta (▲ byczy / ▼ niedźwiedzi) na trzeciej świecy
- Rysowany jest półprzezroczysty prostokąt ustawienia obejmujący:
-
- Byczy: Od maksimum świecy 1 do najniższego minimum (świeca 2 lub 3)
- Niedźwiedzi: Od minimum świecy 1 do najwyższego maksimum (świeca 2 lub 3)
- Ten prostokąt oznacza "strefę walki", gdzie nastąpiło odwrócenie
FAZA 2 - POTWIERDZENIE LUB UNIEWAŻNIENIE: ⏳
System czeka na następną świecę po wzorze, aby go zweryfikować:
Potwierdzenie bycze: ✅
- Zamknięcie następnej świecy musi przekroczyć maksimum świecy 1 (sufit prostokąta)
- Pojawia się pełna kropka (●) oznaczająca potwierdzenie
- Prostokąt staje się aktywną strefą wsparcia
Potwierdzenie niedźwiedzie: ✅
- Zamknięcie następnej świecy musi przebić minimum świecy 1 (podłoga prostokąta)
- Pojawia się pełna kropka (●) oznaczająca potwierdzenie
- Prostokąt staje się aktywną strefą oporu
Unieważnienie: ❌
- Bycze nie powiodło się, jeśli: zamknięcie poniżej minimum prostokąta LUB pojawia się wzór niedźwiedzi
- Niedźwiedzie nie powiodło się, jeśli: zamknięcie powyżej maksimum prostokąta LUB pojawia się wzór byczy
- Prostokąt przestaje się rozszerzać (wzór umiera)
Oczekujące rozszerzenie: ⏸️
- Jeśli nie ma potwierdzenia ani niepowodzenia, prostokąt rozszerza się poziomo świeca po świecy
FAZA 3 - AKTYWNA STREFA WSPARCIA/OPORU: 🎯
- Po potwierdzeniu strefa rozszerza się w prawo w nieskończoność
- Strefa bycza: Pozostaje aktywna, dopóki cena utrzymuje się powyżej podłogi
- Strefa niedźwiedzia: Pozostaje aktywna, dopóki cena utrzymuje się poniżej sufitu
- Strefa dezaktywuje się, gdy cena całkowicie ją przebije w przeciwnym kierunku
⚙️ GŁÓWNA KONFIGURACJA
Tryb wzoru
Kontroluje, które warianty wzoru są akceptowane:
- Normalny: Akceptuje tylko, gdy świeca 3 zamyka się WEWNĄTRZ zakresu świecy 1
-
- Byczy: Zamknięcie < maksimum świecy 1 (umiarkowane odwrócenie)
- Niedźwiedzi: Zamknięcie > minimum świecy 1 (umiarkowane odwrócenie)
- Ulepszony: Akceptuje tylko, gdy świeca 3 zamyka się POZA zakresem świecy 1 🔥
-
- Byczy: Zamknięcie > maksimum świecy 1 (eksplodujące odwrócenie)
- Niedźwiedzi: Zamknięcie < minimum świecy 1 (eksplodujące odwrócenie)
- Wszystkie (zalecane): Akceptuje oba typy bez rozróżnienia ⭐
Typ wsparcia/oporu
- Poziom: Podstawowa funkcjonalność linii (ograniczona w tej wersji)
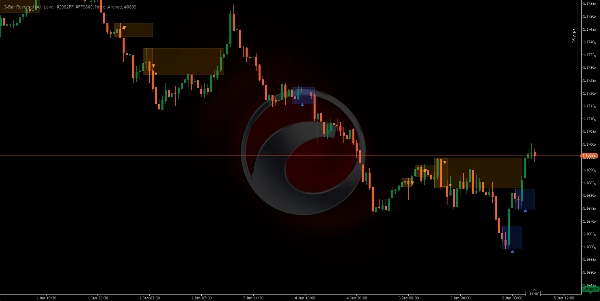
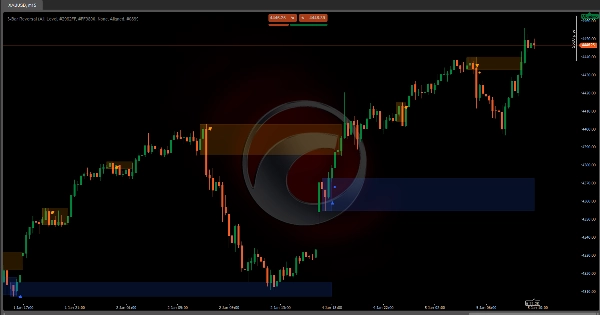
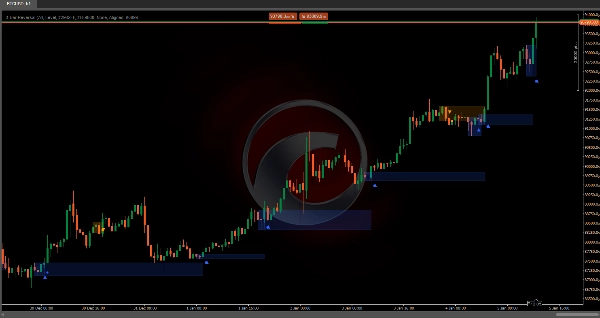
- Strefa: Rysuje zacienione prostokąty oznaczające strefy SR po potwierdzeniu 📦
- Brak: Brak stref SR, pokazuje tylko wykryte wzory
Kolory do personalizacji 🎨
- Kolor byczego odwrócenia: Dla trójkątów, prostokątów i byczych stref (domyślnie:
#2962FF- niebieski) - Kolor niedźwiedziego odwrócenia: Dla trójkątów, prostokątów i niedźwiedzich stref (domyślnie:
#FF9800- pomarańczowy) - Kolor byczego trendu: Dla wizualizacji filtra trendu (domyślnie:
#089981- zielony) - Kolor niedźwiedziego trendu: Dla wizualizacji filtra trendu (domyślnie:
#F23645- czerwony)
🔧 FILTRY TRENDU
Wskaźnik może filtrować wzory na podstawie ogólnego kierunku trendu, używając czterech metod:
1. Chmura średnich kroczących ☁️
Używa dwóch średnich kroczących do identyfikacji trendu:
Parametry:
- Typ średniej kroczącej: Prosta, wykładnicza, Hull, ważona itd. (domyślnie: Hull)
- Szybki okres: 50 (domyślnie)
- Wolny okres: 200 (domyślnie)
Logika filtra (wyrównana):
- Wykryto trend byczy, gdy: Cena > szybka MA ORAZ szybka MA > wolna MA ✅
- Wykryto trend niedźwiedzi, gdy: Cena < szybka MA ORAZ szybka MA < wolna MA ✅
- Pokazuje tylko wzory bycze w trendzie byczym i wzory niedźwiedzie w trendzie niedźwiedzim
Logika odwrotna (przeciwny):
- Odwraca warunki, aby wychwycić główne odwrócenia kontratrendowe
2. Supertrend 📈
Wskaźnik podążania za trendem oparty na zmienności (ATR):
Parametry:
- Okres ATR: 10 (domyślnie) - okno obliczania zmienności
- Współczynnik mnożnika: 3.0 (domyślnie) - czułość wskaźnika
Logika:
- Oblicza górną i dolną wstęgę za pomocą ATR
- Cena powyżej Supertrend = trend byczy 🟢
- Cena poniżej Supertrend = trend niedźwiedzi 🔴
- Filtruje wzory zgodnie z skonfigurowanym wyrównaniem
3. Kanały Donchiana 📊
Używa ekstremów cenowych z określonego okresu:
Parametry:
- Długość kanału: 13 (domyślnie)
Logika:
- Górny kanał = najwyższe maksimum z N okresów
- Dolny kanał = najniższe minimum z N okresów
- Punkt środkowy = (górny + dolny) / 2
- Cena powyżej punktu środkowego = trend byczy 🟢
- Cena poniżej punktu środkowego = trend niedźwiedzi 🔴
4. Brak (bez filtra) 🔓
Pokazuje WSZYSTKIE wykryte wzory 3-słupkowe bez uwzględniania ogólnego trendu. Przydatne dla:
- Rynków o ograniczonym zakresie
- Czystej analizy wzorców
- Handlu odwróceniami w dowolnym kontekście
Wyrównanie trendu
Stosuje się, gdy filtr jest aktywny:
- Wyrównane: Pokazuje tylko wzory zgodne z zidentyfikowanym trendem ➡️
-
- Tylko wzory bycze w trendzie byczym
- Tylko wzory niedźwiedzie w trendzie niedźwiedzim
- Przeciwny: Pokazuje tylko wzory przeciwne do zidentyfikowanego trendu 🔄
-
- Wzory bycze w trendzie niedźwiedzim (główne odwrócenie)
- Wzory niedźwiedzie w trendzie byczym (główne odwrócenie)
Podsumowanie
It operates in three phases: pattern detection, confirmation or invalidation based on the next candle's behavior, and establishing active support or resistance zones that extend while price respects them. The indicator supports configurable pattern modes (Normal, Enhanced, or All) to control acceptance criteria for reversals.
Trend filtering is available through four methods—Moving Average Cloud, Supertrend, Donchian Channels, or no filter—allowing users to align pattern signals with overall market trends or capture counter-trend reversals. Confirmed reversal zones are displayed as shaded rectangles or levels, customizable in color for bullish and bearish signals, trend filters, and zones.
This tool is designed for use on any timeframe and across various markets, including forex pairs (EURUSD, GBPUSD, USDJPY, NZDUSD), commodities (XAUUSD), indices (NAS100), and cryptocurrencies (BTCUSD). It aids traders in detecting high-probability reversals, filtering false signals, and identifying support and resistance zones with clear visual markers.


