
Descrição
https://chartshots.spotware.com/c/695bec6c74055
https://chartshots.spotware.com/c/695bed35bf7b7
https://chartshots.spotware.com/c/695bed6b139df
https://chartshots.spotware.com/c/695bed8ea6bdb
📊 BLOCO PIVOT BREAKER
🤔
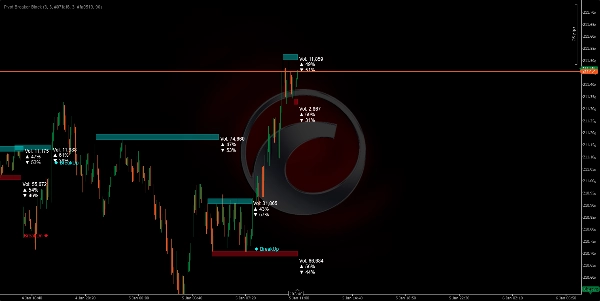
O Bloco Pivot Breaker é um indicador visual que identifica automaticamente pontos-chave de reversão de preço (máximas e mínimas locais) e constrói "blocos de preço" ao redor desses níveis críticos. Quando o preço se aproxima novamente desses níveis semelhantes, o algoritmo desenha retângulos (zonas) representando resistência (Oferta) e suporte (Demanda) nessas áreas.
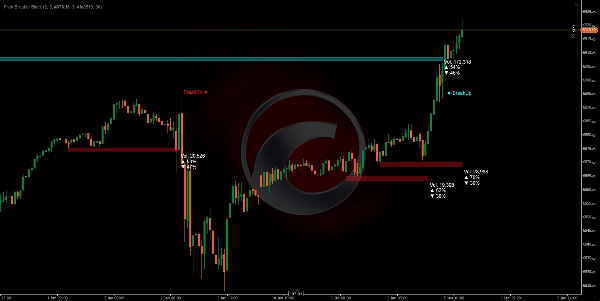
O sistema monitora continuamente se o preço rompe essas zonas, gerando sinais visuais claros: BreakUp (ruptura de alta) 🔼 ou BreakDn (ruptura de baixa) 🔽.
PARA QUE SERVE? 🎯
1. Identificar Zonas de Controle do Mercado 🗺️
O algoritmo detecta onde o preço mostrou forte resistência (teto de venda) ou suporte (piso de compra). Quando esses níveis aparecem várias vezes, o mercado confirma sua importância.
2. Visualizar Acumulação e Distribuição de Volume ⚖️
Cada bloco mostra:
- Volume total processado naquela zona
- % de compras (velas de alta) 📈
- % de vendas (velas de baixa) 📉
Isso permite ver se o mercado está comprando ou vendendo dentro daquela área, revelando a intenção do mercado.
3. Antecipar Pontos de Rompimento 🚨
Quando o preço se aproxima dessas zonas, você tem a maior probabilidade de um movimento significativo ocorrer. O algoritmo detecta automaticamente quando o preço as rompe, alertando você em tempo real.
COMO A LÓGICA FUNCIONA ⚙️
Fase 1: Detecção de Pivot (Pontos de Reversão) 🔍
O algoritmo procura máximas e mínimas que atendam a um critério específico:
- Pivot High: Uma vela cuja máxima é maior do que as 5 velas anteriores E as 5 velas subsequentes.
- Pivot Low: Uma vela cuja mínima é menor do que as 5 velas anteriores E as 5 velas subsequentes.
Esse parâmetro "5" (Pivot Lookback) é ajustável com base na volatilidade que você deseja capturar.
Fase 2: Reconhecimento da Zona de Controle 🎯
Uma vez identificado um pivot, o sistema o compara com o pivot anterior do mesmo tipo. Se a diferença entre eles for menor que 20% do ATR (medida atual de volatilidade), significa que o mercado está revisitando um nível semelhante previamente rejeitado.
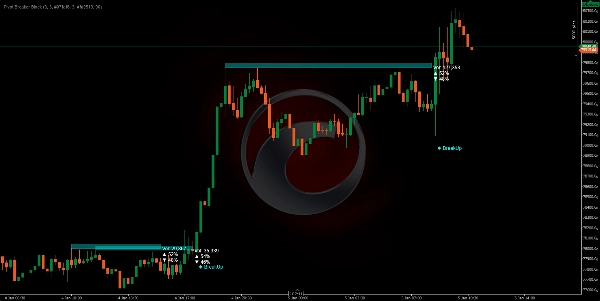
Fase 3: Dimensionamento da Zona 📏
A altura de cada bloco é calculada dinamicamente usando o ATR (Average True Range):
- Oferta (Vermelho): O teto está ATR × 0.5 pontos acima do pivot.
- Demanda (Ciano): O piso está ATR × 0.5 pontos abaixo do pivot.
Isso significa que as zonas se adaptam automaticamente à volatilidade do ativo. Em mercados voláteis, as zonas são mais amplas; em mercados calmos, são mais estreitas.
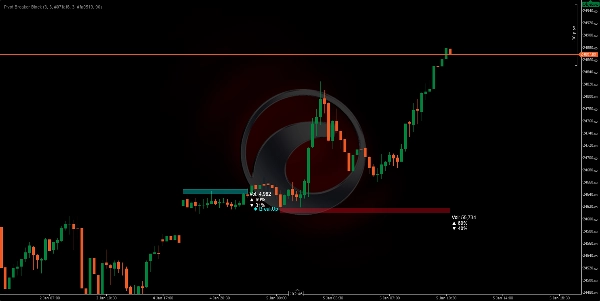
Fase 4: Análise de Volume em Tempo Real 💹
Enquanto o preço estiver dentro da zona, o algoritmo soma todos os volumes de compra e venda desde o início do bloco:
- Compra: Todas as velas onde o fechamento é maior que a abertura (volume de alta).
- Venda: Todas as velas onde o fechamento é menor que a abertura (volume de baixa).
Esses percentuais mostram a intenção dominante dentro daquela zona.
Fase 5: Detecção de Rompimento 🚀
O algoritmo monitora cada nova vela:
- BreakUp (↑): O fechamento cruza acima do teto da Oferta → Sinal de rompimento de alta.
- BreakDn (↓): O fechamento cai abaixo do piso da Demanda → Sinal de rompimento de baixa.
Quando isso acontece, o bloco é desativado e um sinal de texto aparece na tela.
COMO USAR 🛠️
Instalação e Configuração ⚙️
- Adicione o indicador à sua plataforma cTrader.
- Acesse os parâmetros ajustáveis:
ParâmetroSignificadoRecomendação
Pivot Lookback
Quantas velas à esquerda/direita são avaliadas para confirmar um pivot
5 (padrão), aumente em TFs maiores
Fator da Zona de Oferta
Altura do bloco vermelho (Resistência)
5.0 (padrão), ajuste conforme preferência
Fator da Zona de Demanda
Altura do bloco ciano (Suporte)
5.0 (padrão), ajuste conforme preferência
Transparência
Opacidade do bloco (0=invisível, 255=opaco)
90 (recomendado para visibilidade)
Cores
Personalize a aparência visual
Vermelho para Oferta, Ciano para Demanda
Estratégia de Negociação 💡
Cenário 1: Entrada Longa (Compra) 📈
- Espere o preço formar um bloco de Demanda (ciano) com % de compras > 55%.
- Ao ver um BreakUp, confirme sua entrada de alta.
- Stop Loss (SL) abaixo do piso do bloco.
Cenário 2: Entrada Curta (Venda) 📉
- Procure um bloco de Oferta (vermelho) com % de vendas > 55%.
- No BreakDn, abra uma posição de baixa.
- Stop Loss (SL) acima do teto do bloco.
Cenário 3: Reversão (Retorno à Média) 🔄
- Se o preço estiver dentro de um bloco de Demanda mas o % de compras estiver baixo (< 45%)...
- Antecipe que o preço irá recuar para cima sem atingir um BreakUp.
- Entre em uma compra perto do piso com Take Profit (TP) no teto.
Timeframes Ótimos ⏰
- H4/D1: Blocos mais significativos, movimentos de maior duração.
- H1: Bom equilíbrio entre ruído e oportunidades.
- M15: Entrada rápida, requer confirmação de volume.
Resumo
The indicator continuously monitors price action relative to these zones, providing real-time breakout signals: "BreakUp" for bullish breakouts above resistance and "BreakDn" for bearish breakouts below support. Each block displays cumulative volume data, including total volume processed and the percentage of buying (bullish) versus selling (bearish) activity, helping traders assess market intention within these areas.
Pivot Breaker Block supports multiple trading strategies, including breakout entries and mean reversion, with configurable parameters such as pivot lookback period, zone height factors, and visual transparency. It is suitable for various markets including Forex, indices, commodities, stocks, and cryptocurrencies, and works effectively on timeframes from 15 minutes to daily charts.
Key features:
- Automatic pivot detection with adjustable lookback
- Dynamic supply and demand zone sizing based on ATR
- Real-time volume accumulation and buy/sell ratio visualization
- Breakout alerts with on-screen signals
- Supports multiple asset classes and timeframes for versatile use


![Logótipo de "[Hamster-Coder] Moving Average MTF"](https://cdn.ctrader.com/image/webp/b11b98b1-194d-4b8e-b00e-d611826ad159_31226)

