Opis
CO ROBI
Wsparcie i opór oparte na płynności identyfikują miejsca, gdzie cena faktycznie się odwróciła — nie tylko tam, gdzie można narysować linie.
Wykrywa punkty zwrotne na wykresie, przypisuje je do psychologicznych poziomów okrągłych liczb i kwantyfikuje aktywność kupna/sprzedaży w każdej strefie. Widzisz, które poziomy wykazują znaczącą aktywność płynności, a które to tylko puste linie.
Efektem jest wsparcie i opór z kontekstem — wbudowanym nastawieniem, absorpcją wolumenu, efektywnością i interpretacją umożliwiającą działanie.
DLACZEGO TO MA ZNACZENIE
Tradycyjne metody wsparcia i oporu mają wspólną słabość: pokazują gdzie cena była, ale nic nie mówią o tym, co się tam wydarzyło.
Poziom cen dotknięty dwukrotnie i poziom testowany piętnaście razy z dużym wolumenem wyglądają identycznie na standardowym wskaźniku SR. Ale zachowują się bardzo różnie, gdy cena do nich wraca.
Problem
Rysowanie linii na punktach zwrotnych jest łatwe. Zrozumienie, czy te poziomy się utrzymają, przełamią, czy złapią traderów wymaga głębszej analizy, której większość narzędzi SR nie oferuje:
- Ile faktycznie odwróceń miało miejsce na poziomie?
- Czy dominowali kupujący czy sprzedający?
- Czy odrzut był efektywny, czy wymagał dużej absorpcji wolumenu?
- Czy poziom gromadzi energię na wybicie, czy rozprowadza ją przed niepowodzeniem?
Rozwiązanie
Ten wskaźnik mierzy sygnaturę płynności na każdym poziomie — ile odwróceń miało miejsce, jak głębokie były, ile wolumenu było zaangażowane i czy kupujący czy sprzedający działali efektywniej.
Zamiast zgadywać, które poziomy są ważne, widzisz dokładnie, co rynek robił w każdej strefie.
JAK TO DZIAŁA
Adaptacyjne wykrywanie punktów zwrotnych
Wskaźnik używa metody wygładzania opartej na regresji, aby odfiltrować szumy rynkowe i zidentyfikować prawdziwe punkty zwrotne — momenty, w których cena zobowiązała się do zmiany kierunku, a nie losowe knoty.
Dostępne są trzy tryby wykrywania:
- Główne — Tylko potwierdzone, mocne odwrócenia
- Standardowe — Cała podstawowa struktura punktów zwrotnych
- Pomniejsze — Zawiera wewnętrzne punkty zwrotne dla szczegółowej analizy
Mapowanie stref okrągłych liczb
Punkty zwrotne są automatycznie przypisywane do psychologicznych poziomów cenowych. Odstępy stref dostosowują się do zmienności instrumentu na podstawie średniej głębokości punktów zwrotnych — nie jest potrzebna ręczna konfiguracja.
Ustaw mnożnik na zero, a wskaźnik automatycznie obliczy optymalne odstępy.
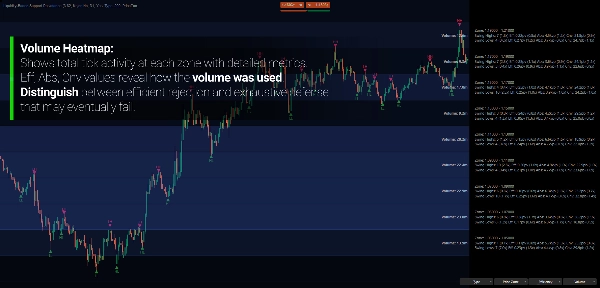
Metryki płynności
Na każdej strefie wskaźnik oblicza:
- Głębokość — Jak daleko cena przemieściła się od punktu zwrotnego (w pipsach)
- Wolumen — Całkowita aktywność ticków podczas punktu zwrotnego
- Efektywność — Ruch ceny na jednostkę wolumenu (mierzy efektywność wykonania)
- Absorpcja — Wolumen potrzebny do powstrzymania ruchu ceny (wysiłek utrzymania poziomu)
- Przekonanie — Ruch ceny na świecę (momentum i zaangażowanie)
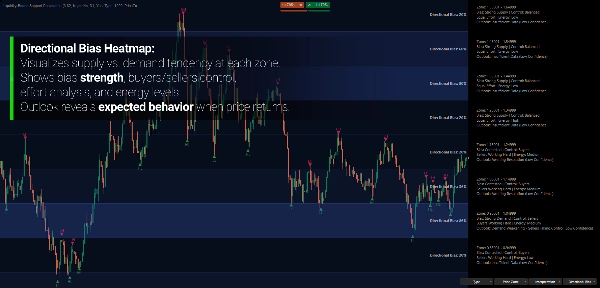
Analiza kierunkowa
Każda strefa jest analizowana pod kątem:
- Nastawienia — Czy to strefa podaży (więcej szczytów) czy popytu (więcej dołków)?
- Kontroli — Czy kupujący czy sprzedający działają tu efektywniej?
- Energii — Jak dużo całkowitej aktywności w porównaniu do poziomu bazowego?
Te metryki łączą się, tworząc prostą w zrozumieniu interpretację tego, co dzieje się na każdym poziomie.
KLUCZOWE CECHY
Wiele trybów etykiet
- Cena — Prosta identyfikacja strefy
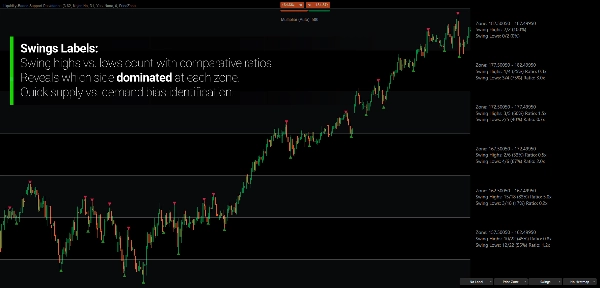
- Punkty zwrotne — Liczba szczytów vs. dołków z proporcjami
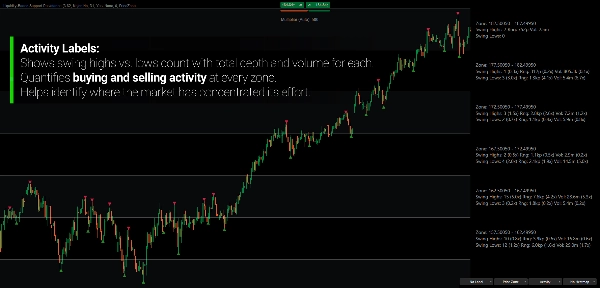
- Aktywność — Głębokość, wolumen i proporcje porównawcze
- Efektywność — Obliczone metryki pokazujące precyzję instytucjonalną
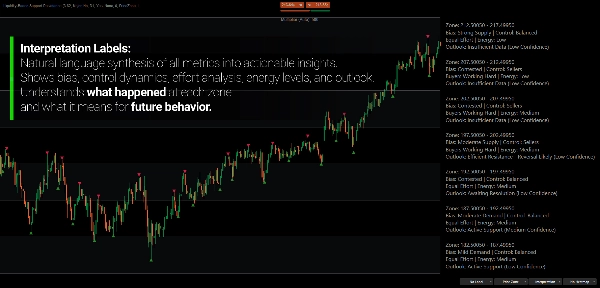
- Interpretacja — Analiza w naturalnym języku nastawienia, kontroli i perspektywy
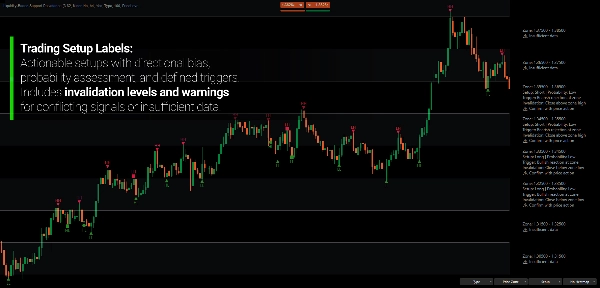
- Ustawienia — Praktyczne ustawienie transakcji z wyzwalaczem, unieważnieniem i prawdopodobieństwem
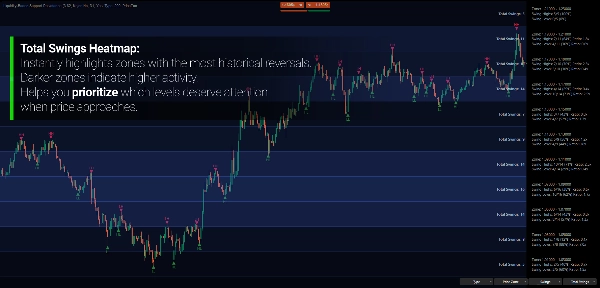
Wizualizacja mapy cieplnej
Przekształć surowe dane w natychmiastową wizualną informację. Mapa cieplna koduje dowolną metrykę we wszystkich widocznych strefach, używając trzypunktowego gradientu kolorów — zimny, średni, gorący.
Zamiast czytać liczby na każdym poziomie, widzisz wzory na pierwszy rzut oka:
- Gdzie koncentruje się wolumen?
- Które strefy wykazują silne nastawienie kierunkowe?
- Gdzie efektywność jest najwyższa?
- Które poziomy pochłonęły najwięcej wysiłku?
Dostępnych jest 17 trybów mapy cieplnej:
- Aktywność — Całkowite punkty zwrotne, szczyty, dołki
- Proporcje — Stosunek szczytów/dołków, stosunek głębokości, stosunek wolumenu, stosunek czasu trwania
- Surowe metryki — Głębokość, wolumen
- Obliczone — Efektywność, absorpcja, przekonanie, nastawienie kierunkowe
Analiza wielookresowa
Analizuj strukturę punktów zwrotnych na wyższych interwałach, jednocześnie obserwując ruch cen na niższych. Zobacz aktywność punktów zwrotnych z interwału dziennego przypisaną do stref H1 bez zmiany wykresów.
Podwójny tryb wyświetlania
- Poziom cenowy — Tradycyjna pojedyncza linia na okrągłej liczbie
- Strefa cenowa — Górne i dolne granice pokazujące pełną szerokość strefy
Adaptacyjne odstępy stref
Ustaw mnożnik na zero, a wskaźnik automatycznie obliczy optymalną szerokość strefy na podstawie średniej głębokości punktów zwrotnych twojego instrumentu. Działa na rynku forex, indeksach, kryptowalutach i towarach bez ręcznego dostrajania.
TRYB INTERPRETACJI I USTAWIEŃ
Wskaźnik nie tylko pokazuje dane — syntetyzuje metryki w analizę, na którą możesz reagować.
Tryb interpretacji zapewnia:
- Ocena nastawienia (Silna/Umiarkowana/Łagodna podaż lub popyt)
- Identyfikacja kontroli (Kupujący, Sprzedający lub Zrównoważony)
- Analiza wysiłku (kto bardziej się stara utrzymać pozycję)
- Poziom energii (Wysoki/Średni/Niski względem poziomu bazowego)
- Oświadczenie o perspektywie opisujące prawdopodobne zachowanie
Tryb ustawień idzie dalej:
- Nastawienie kierunkowe (Long, Short lub Neutralne)
- Warunek wyzwalający wejście
- Kryteria unieważnienia
- Ocena prawdopodobieństwa (Wysokie/Średnie/Niskie/Bardzo niskie)
- Ostrzeżenie przy sprzecznych sygnałach
Przykładowy wynik:
"Ustawienie: Long | Prawdopodobieństwo: Średnie" "Wyzwalacz: Przebicie i zamknięcie powyżej strefy" "Unieważnienie: Zamknięcie poniżej strefy"
JAK CZYTAĆ STREFY
Strefa podaży — Więcej szczytów niż dołków. Cena ma tendencję do odwracania się w dół w tym miejscu. Sprzedający historycznie bronili tego poziomu.
Strefa popytu — Więcej dołków niż szczytów. Cena ma tendencję do odwracania się w górę w tym miejscu. Kupujący historycznie bronili tego poziomu.
Strefa sporna — Mniej więcej równa liczba szczytów i dołków. Brak wyraźnego nastawienia kierunkowego. Często powoduje gwałtowne ruchy po rozwiązaniu.
Wysoka energia — Znaczna absorpcja wolumenu względem poziomu bazowego. Poziom jest aktywnie broniony.
Niska energia — Minimalna aktywność. Poziom może łatwo się przełamać lub być po prostu ignorowany.
Nierównowaga efektywności — Gdy jedna strona przesuwa cenę dalej na jednostkę wolumenu, ma kontrolę niezależnie od tego, kto wkłada więcej wysiłku.
DLA KOGO TO JEST
Ten wskaźnik jest przeznaczony dla traderów, którzy chcą mieć kontekst za swoimi poziomami, a nie tylko linie na wykresie.
Jest dobrze dopasowany do traderów opartych na strukturze, którzy włączają do swoich decyzji takie koncepcje jak analiza wolumenu, wysiłek vs. rezultat czy dynamika podaży/popytu.
Traderzy swingowi i pozycyjni skorzystają z widzenia, które poziomy mają instytucjonalne znaczenie przed planowaniem wejść wokół nich.
Analitycy wielookresowi mogą oglądać strukturę płynności na wyższych interwałach bezpośrednio na wykresach wykonawczych.
To nie jest generator sygnałów. To kontekstowe ramy do zrozumienia, co rynek robił na kluczowych poziomach cenowych — i co to sugeruje o przyszłym zachowaniu.
CO GO WYRÓŻNIA
Większość wskaźników wsparcia i oporu odpowiada na pytanie: "Gdzie cena się odwróciła?"
Ten wskaźnik odpowiada: "Co się stało, gdy cena się tam odwróciła i co nam to mówi?"
Kwantyfikując aktywność na każdym poziomie — nie tylko oznaczając miejsca punktów zwrotnych — zyskujesz wgląd w:
- Czy poziom prawdopodobnie się utrzyma czy przełamie
- Która strona działała efektywniej
- Czy energia buduje się na wybicie czy wyczerpanie
- Jak zbudować transakcję wokół poziomu z określonym wyzwalaczem i unieważnieniem
Analiza dostosowuje się automatycznie do twojego instrumentu. Nie wymaga optymalizacji — strukturę rynku definiują parametry.
---
ZROZUMIENIE PŁYNNOŚCI NA POZIOMACH CENOWYCH
Wsparcie i opór to nie magiczne linie, na których cena odbija się. To strefy, gdzie koncentrują się przeciwstawne interesy.
Na poziomie wsparcia kupujący historycznie byli gotowi absorbować presję sprzedaży. Na oporze sprzedający absorbowali presję kupna. Siła poziomu zależy nie od tego, ile razy był dotknięty, ale od ile było potrzebne, by go utrzymać — i czy ta obrona pozostaje nienaruszona.
Dlatego dwa poziomy z identyczną historią cen mogą zachowywać się zupełnie inaczej. Jeden mógł pochłonąć ogromny wolumen, by się utrzymać — co sugeruje ostateczne wyczerpanie. Inny mógł odrzucić cenę bez wysiłku — co sugeruje silne przekonanie.
Wskaźniki oparte na tej koncepcji nie przewidują, dokąd pójdzie cena. Pomagają zrozumieć co już się wydarzyło na kluczowych poziomach, aby podejmować lepsze decyzje, gdy cena wróci.
---
Uwaga: Ten wskaźnik modeluje dynamikę płynności poprzez wolumen ticków i interakcję ceny — nie bezpośrednie dane z księgi zleceń. Chociaż wolumen ticków reprezentuje aktywność na poziomie brokera, a nie wolumen giełdowy, wiarygodnie wskazuje względne poziomy uczestnictwa i koreluje z rzeczywistymi wzorcami wolumenu rynkowego.
Trading wiąże się z ryzykiem. Ten wskaźnik jest narzędziem analizy technicznej — zawsze stosuj odpowiednie zarządzanie ryzykiem.


![Logo „[Hamster-Coder] Pivot Points MTF”](https://cdn.ctrader.com/image/webp/4c143e5a-309c-40e3-a578-f04d1e133ffa_31159)


