
ATR advanced
Indicatore
Versione 1.0, Apr 2026
Windows, Mac
4.3
Recensioni: 3

32
Vendite
992
Installazioni gratuite
Descrizione
Sistema Avanzato di Volatilità e Trend ATR
L'Average True Range (ATR) standard è un ottimo strumento per misurare la volatilità del mercato, ma nella sua forma predefinita è solo una singola linea difficile da leggere. Ti dice se la volatilità è alta o bassa, ma non ti dice come operare su di essa.
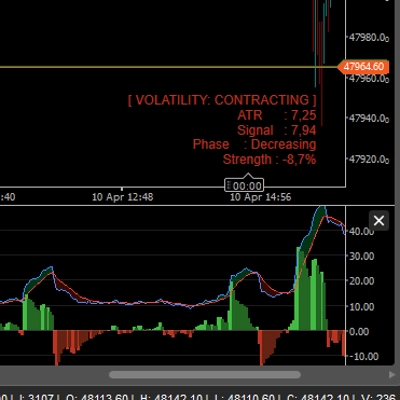
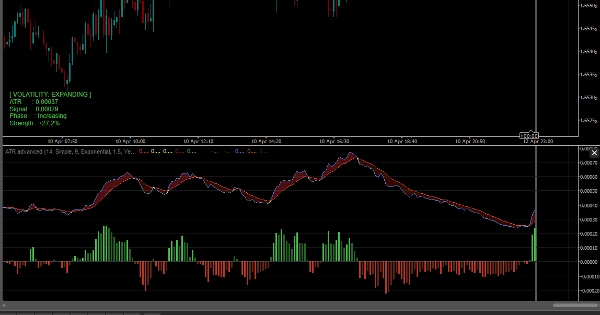
L'ATR Advanced trasforma questa metrica di base in un sistema di trading visivo completo. Introducendo una Linea di Segnale di Volatilità, Barre Direzionali colorate e un Istogramma di Momentum, ti indica non solo quando il mercato si muove, ma esattamente quanta energia sostiene il trend attuale.
Caratteristiche principali della VERSIONE COMPLETA:
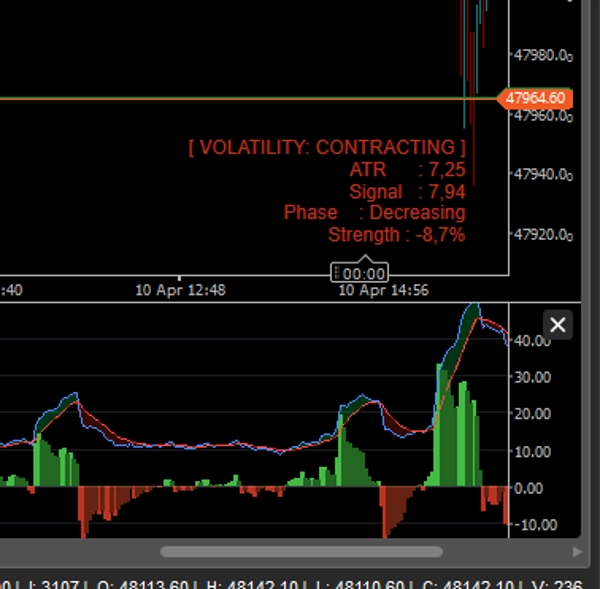
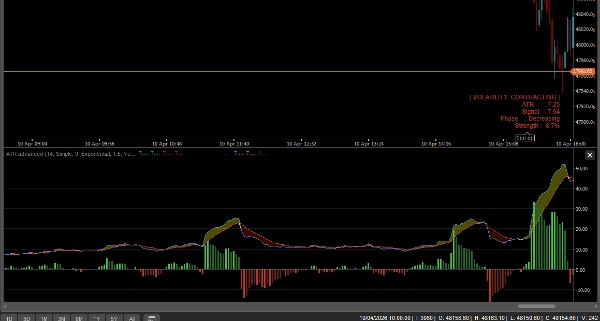
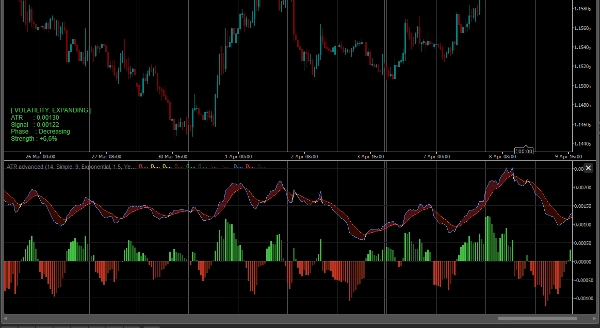
- Nuvole di Espansione della Volatilità: Abbiamo aggiunto una Media Mobile (Linea di Segnale) all'ATR. Lo spazio tra l'ATR e la sua Linea di Segnale è riempito con una Nuvola dinamica.
-
- Nuvola Verde (in Espansione): La volatilità sta aumentando. Il mercato si sta risvegliando e i trend sono forti.
- Nuvola Rossa (in Contrazione): La volatilità sta diminuendo. Il mercato sta consolidando o muovendosi lateralmente.
- Istogramma di Momentum: Un istogramma personalizzato in basso traccia la differenza esatta tra l'ATR e la Linea di Segnale, aiutandoti a individuare i breakout di volatilità prima che si manifestino completamente.
- Colorazione Intelligente delle Barre (Direzione + Volatilità): Questa è la funzione definitiva. L'indicatore legge sia la direzione del prezzo (rialzista/ribassista) CHE lo stato della volatilità, colorando le tue candele di conseguenza:
-
- Verde/Rosso brillante: Trend forte + volatilità in espansione (perfetto per trading di breakout e trend).
- Verde/Rosso scuro: Trend debole + volatilità in contrazione (attenzione: il momentum sta diminuendo).
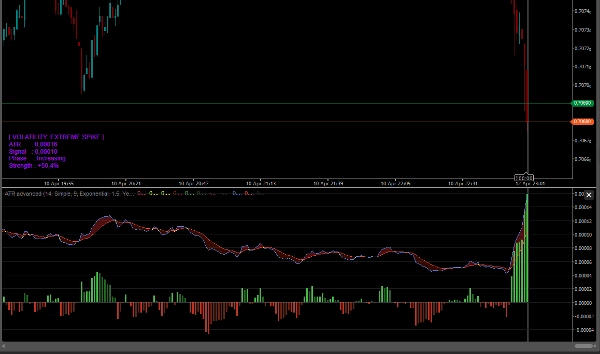
- Rilevamento di Volatilità Estrema: Quando l'ATR sale anormalmente (ad esempio durante eventi di notizie importanti o massimi di mercato), le candele diventano Viola (Estremo), avvisandoti di un potenziale climax o breakout massiccio.
- Dashboard Informativa in Tempo Reale: Un elegante pannello sul grafico mostra il valore esatto dell'ATR, la fase di volatilità (in espansione/contrazione) e una lettura percentuale della forza.
- Completamente Sbloccato: Opera su QUALSIASI simbolo (Forex, Crypto, Indici, Azioni) e QUALSIASI timeframe senza limitazioni. Accesso a vita.
Come fare trading con esso?
- Il Breakout: Evita di fare trading quando la Nuvola di Volatilità è Rossa (in Contrazione). Aspetta che l'ATR superi la Linea di Segnale (la Nuvola diventa Verde) e che le tue candele si colorino di Verde brillante o Rosso brillante. Questo conferma un vero breakout ad alta probabilità.
- Stop mobili: Rimani nelle tue operazioni vincenti finché la Nuvola di Volatilità rimane Verde. Quando scende e diventa Rossa, significa che il momentum è esaurito—un ottimo momento per prendere profitto.
- Avviso di Climax: Se sei in un trend e le candele diventano improvvisamente Viola, fai attenzione! Questo rappresenta un picco di volatilità estrema, che spesso si verifica alla fine di un trend poco prima di un forte inversione.
Riepilogo
Riepilogo AI
ATR Advanced is a volatility and trend indicator that enhances the standard Average True Range (ATR) by providing a comprehensive visual trading system. It integrates a Volatility Signal Line (a moving average of ATR) and fills the area between ATR and this line with dynamic Volatility Expansion Clouds. Green clouds indicate expanding volatility and strong trends, while red clouds signal contracting volatility and market consolidation.
Key features include a Momentum Histogram that tracks the difference between ATR and its Signal Line to identify volatility breakouts early, and smart bar coloring that reflects both price direction and volatility state. Bright green/red bars denote strong trends with expanding volatility, dark green/red bars indicate weak trends with contracting volatility, and purple bars warn of extreme volatility spikes often associated with trend climaxes or major events.
The indicator also includes a real-time on-chart dashboard displaying ATR values, volatility phases, and strength percentages. It supports all symbols—including Forex, cryptocurrencies, indices, and stocks—and any timeframe without limitations.
Traders can use it to confirm breakouts when volatility clouds turn green and bars brighten, manage trailing stops by monitoring volatility contraction, and receive warnings of potential trend reversals during extreme volatility spikes.
Key features include a Momentum Histogram that tracks the difference between ATR and its Signal Line to identify volatility breakouts early, and smart bar coloring that reflects both price direction and volatility state. Bright green/red bars denote strong trends with expanding volatility, dark green/red bars indicate weak trends with contracting volatility, and purple bars warn of extreme volatility spikes often associated with trend climaxes or major events.
The indicator also includes a real-time on-chart dashboard displaying ATR values, volatility phases, and strength percentages. It supports all symbols—including Forex, cryptocurrencies, indices, and stocks—and any timeframe without limitations.
Traders can use it to confirm breakouts when volatility clouds turn green and bars brighten, manage trailing stops by monitoring volatility contraction, and receive warnings of potential trend reversals during extreme volatility spikes.
Profilo indicatore
Categoria indicatore
Momentum
Tipo di output
Visualizzazione
Segnali
Filtro
Requisiti per i dati
Solo barre
Segnali supportati
Forza del trend
Volatilità
Discussioni
Recensioni dei clienti
4.3
Recensioni: 3
5 | 33 % | |
4 | 67 % | |
3 | 0 % | |
2 | 0 % | |
1 | 0 % |
Recensioni dei clienti
April 24, 2026
20 signals gives enough for a first read, and the signal gets compared with context.
April 18, 2026
3 percent DD is the line to watch, and the log becomes easier to read.
Domande frequenti
ATR
Moving Average
I prodotti disponibili tramite cTrader Store, inclusi bot di trading, indicatori e plugin, sono forniti da sviluppatori terzi e resi disponibili esclusivamente a scopo informativo e di accesso tecnico. cTrader Store non è un broker e non fornisce consulenze in materia di investimento, raccomandazioni individualizzate o garanzie di risultati futuri.






























Prezzo
32
Vendite
992
Installazioni gratuite