present
ลงทะเบียนและรับส่วนลด $50 สำหรับการซื้อครั้งแรกของคุณ
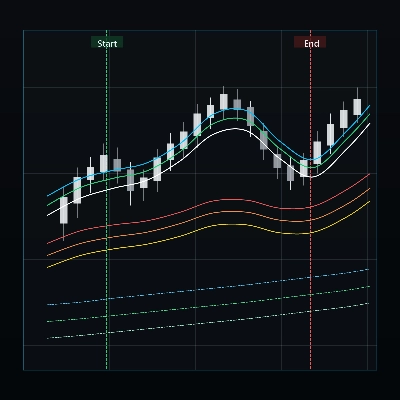
Trading product for IR Moving Cloud อินดิเคเตอร์, image 1
IR Moving Cloud
5.61K
ติดตั้งฟรี

คำอธิบาย

สรุป

โปรไฟล์อินดิเคเตอร์

การสนทนา

รีวิวจากลูกค้า

0.0
รีวิว: 0
รีวิวจากลูกค้า
ยังไม่มีรีวิวสำหรับผลิตภัณฑ์นี้ หากเคยลองแล้ว ขอเชิญมาเป็นคนแรกที่บอกคนอื่น!

คำถามที่พบบ่อย

ผลิตภัณฑ์ที่มีให้บริการผ่าน cTrader Store รวมถึงบอทการเทรด อินดิเคเตอร์ และปลั๊กอิน มีให้บริการโดยนักพัฒนาบุคคลที่สามและมีไว้เพื่อวัตถุประสงค์ในการเข้าถึงข้อมูลและทางเทคนิคเท่านั้น cTrader Store ไม่ใช่โบรกเกอร์และไม่ได้ให้คำแนะนำการลงทุน คำแนะนำส่วนบุคคล หรือการรับประกันผลการดำเนินงานในอนาคต


เพิ่มเติมจากผู้เขียนคนนี้

"IR Candle MTF" โลโก้
4.6
(6)
ฟรี
with this indicator you could see other time frame candle in your chart.
show spread on chart
some user add moving average to macd to see better. in ctrader 4.3.11 there is a problem with this . I make a macd tha
this indicator show macd on chart.
Multi Time Frame Moving Average is a powerful and flexible indicator for cTrader
 this moving include everything that a trader needs from Moving Average.
this indicaotr show distance between Tenkan to Kijun, Close to Kijun and Close to Tenkan 
Add Slowing to IR Moving Average.
IR Candle Open plots customizable opening price lines for daily, weekly, and monthly candles
Coral indicator
you could put your check list in your chart you could split your test with “,” you could put your checklist in indicat
this indicator show other time frame close in lower time frame. for ex: show daily close in m 15.

นอกจากนี้คุณยังอาจชอบ

Advanced Pro Volume Profile: Double Back-to-Back, Institutional Dynamic, Fixed Range & Order Flow
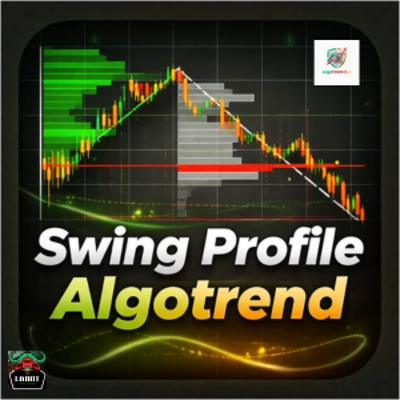
Where price swings, volume speaks
The Parabolic SAR, or "Stop and Reverse," is a dynamic technical analysis tool.
Smart Money Concepts (SMC) indicator with real-time Fair Value Gap (FVG) boxes, $50 round numbers, and live market HUD.
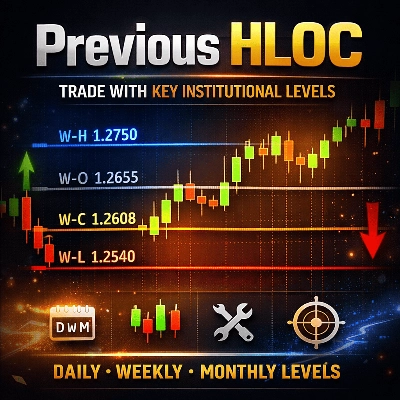
Previous HLOC – Smart Higher-Timeframe Levels for Precision Trading.
"CVD" โลโก้
4.6
(3)
$20
/
$30
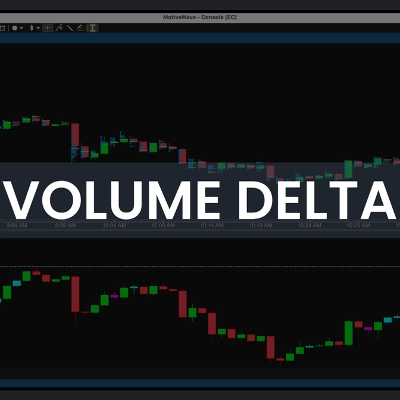
Cumulative Volume Delta tracks the net difference in tick volume between buying and selling pressure over time
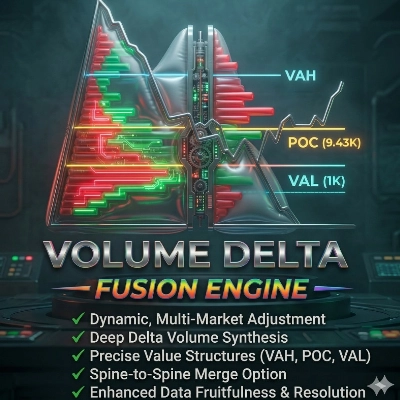
View tick activity across a selected chart range with Point of Control, Value Area High and Value Area Low.
Rejection-based volume profile with tiered heat zones, POC levels and a fully draggable anchor on cTrader.
"MultiTimeframeMA_V1.14" โลโก้
4.6
(5)
จาก $39
Multi-timeframe moving averages with session lines for structured trend analysis directly on the chart.
"Market Cipher B" โลโก้
4.6
(3)
$30
/
$50
Market Cipher B
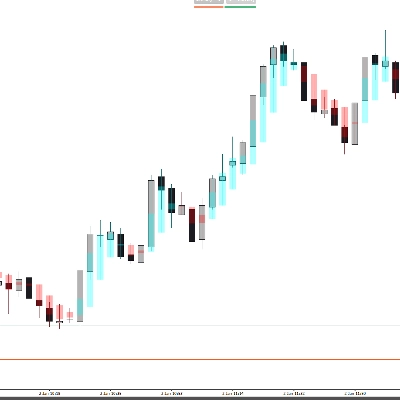
Pro Heikin Ashi Visual Overlay – Clean Trend Visualization
"Parabolic RSI Alert  V1" โลโก้
4.7
(4)
$19
Master RSI reversals with Parabolic SAR precision! Get real-time alerts for high-probability trend changes.
Stochastic Confluence Pro (RSI + Divergence)
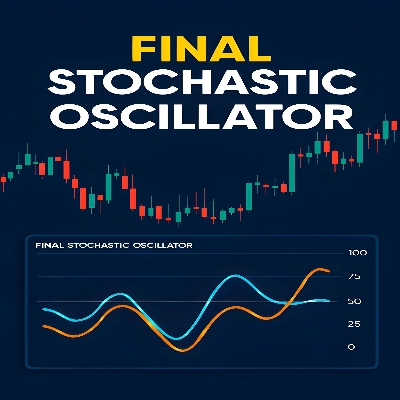
Final Stochastic Oscillator is a next-generation upgrade of the classic stochastic indicator
Easy Trade: Trend & Breakout Indicator for cTrader
"MACARX 2026 ULTRA" โลโก้
4.2
(5)
$20
/
$25
🚀 MACARX Indicator - The Multi-Indicator Trend Fusion 🚀
"crossover 1" โลโก้
4.2
(5)
$19
/
$29
Crossover Buy and Sell Alerts and signals
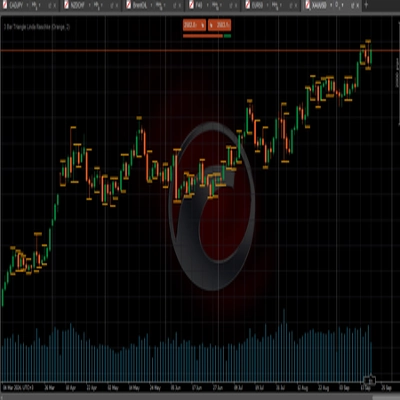
3 bar triangle = high below 2 day high, low above 2 day low

ราคา

5.61K
ติดตั้งฟรี