Descripción
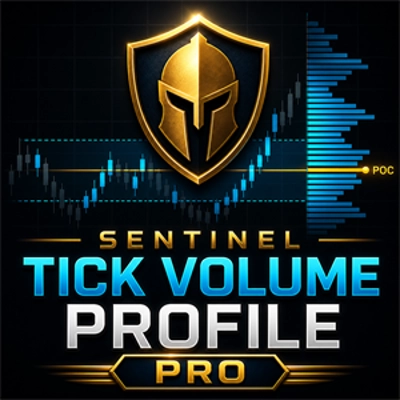
Sentinel Tick Volume Profile Free es un indicador de cTrader no comercial que convierte los datos disponibles de tick-volumen del gráfico en un perfil visual de distribución de precios. Está diseñado para ayudar a los traders manuales a entender dónde se concentró la actividad de ticks dentro de un rango seleccionado del gráfico.
El indicador funciona en tres pasos principales:
1. Seleccionar el Rango del Perfil
El indicador primero decide qué barras deben incluirse en el cálculo del perfil.
Hay dos modos de rango:
Barras de Retroceso
Usa un número fijo de barras recientes del gráfico. Por ejemplo, si Barras de Retroceso está configurado en 240, el indicador construye el perfil a partir de las 240 barras más recientes disponibles en el gráfico.
Sesión Actual
Usa la Hora de Inicio de Sesión y la Hora de Fin de Sesión configuradas. Las horas de sesión se interpretan usando los tiempos del gráfico del indicador. El indicador puede manejar sesiones activas, sesiones completadas, sesiones previas y sesiones nocturnas.
Esta selección de rango determina el área de precio y la muestra de tick-volumen usada para el perfil.
2. Construir el Perfil de Tick-Volumen
Después de seleccionar el rango, el indicador divide el rango de precio de alto a bajo seleccionado en un número configurable de contenedores de precio.
El volumen de ticks del broker de cada barra se asigna entonces a los contenedores tocados por el rango alto-bajo de esa barra.
Esto crea una distribución estimada de tick-volumen por nivel de precio.
A partir de esta distribución, el indicador calcula:
POC Estimado
El contenedor de precio con la mayor concentración de tick-volumen del broker.
VAH Estimado
El límite superior del área de valor estimada.
VAL Estimado
El límite inferior del área de valor estimada.
Área de Valor Estimada
El área alrededor del POC estimado que contiene el porcentaje seleccionado del volumen total de ticks. La configuración predeterminada del área de valor es 70%.
Estos valores son estimaciones basadas en datos de tick-volumen del broker. No son niveles de volumen reportados por la bolsa.
3. Mostrar el Perfil en el Gráfico
El indicador luego muestra el perfil calculado como contexto visual en el gráfico.
Puede mostrar:
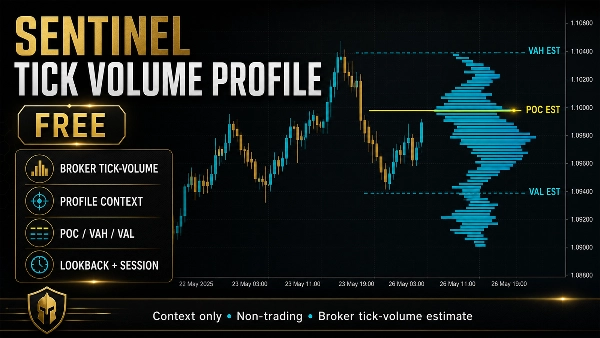
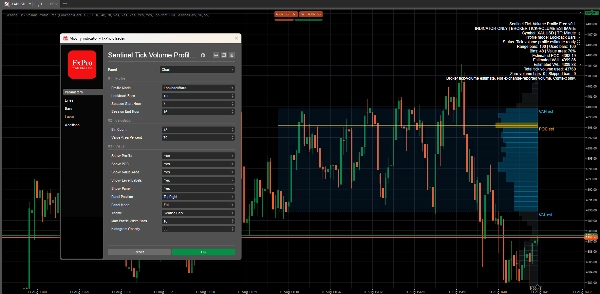
- Un histograma de perfil de tick-volumen
- Línea de POC estimada
- Línea de VAH estimada
- Línea de VAL estimada
- Sombreado del área de valor
- Etiquetas compactas del gráfico: POC est, VAH est y VAL est
- Un resumen en panel con el modo de perfil seleccionado, detalles del rango, conteo de contenedores, niveles estimados, volumen total de ticks usado y texto de limitaciones
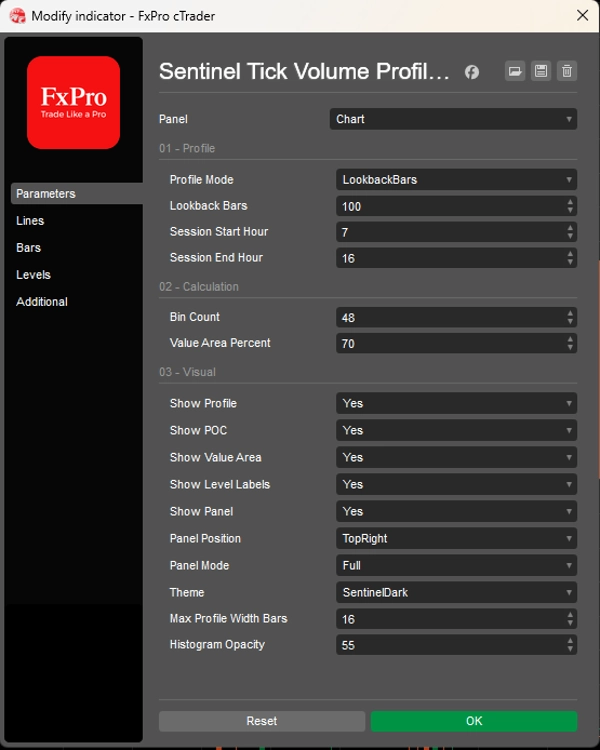
Las etiquetas del gráfico pueden activarse o desactivarse. El perfil, POC, área de valor y panel también pueden controlarse por separado.
MODOS DE PANEL
El indicador incluye tres modos de panel:
Completo
Muestra la información más completa, incluyendo barras de rango, barras usadas, conteo de contenedores, porcentaje del área de valor, POC estimado, VAH estimado, VAL estimado, volumen total de ticks usado, barras de volumen cero, barras omitidas y la limitación del tick-volumen del broker.
Compacto
Muestra un resumen más corto con el modo, conteo de contenedores, estado, POC estimado y rango del área de valor.
Mínimo
Muestra un estado muy compacto de una línea enfocado en el POC estimado y la limitación solo de contexto.
Limitación Importante de Datos
Sentinel Tick Volume Profile Free usa datos de tick-volumen del broker del gráfico. No usa volumen reportado por la bolsa, volumen de futuros, datos de huella, delta, datos de cinta ni datos de flujo de órdenes institucionales.
Por lo tanto, el perfil se entiende mejor como una estimación del perfil de tick-volumen del broker.
Los valores pueden variar dependiendo del broker, símbolo, marco temporal, sesión e historial disponible del gráfico.
Lo que el Indicador No Hace
Sentinel Tick Volume Profile Free no realiza órdenes, no modifica posiciones, no cierra operaciones, no gestiona operaciones ni controla cBots.
No proporciona señales de compra, señales de venta, confirmación de entrada, instrucciones de operación, predicciones de mercado, estimaciones de tasa de éxito, pronósticos de rendimiento ni afirmaciones de rentabilidad.
Es solo una herramienta manual de contexto visual.
Resumen
The indicator divides the high-to-low price range of the selected bars into configurable price bins, allocating tick volume across these bins to estimate volume distribution by price level. It calculates key estimated levels including the Point of Control (POC)—the price bin with the highest tick volume concentration—along with the Value Area High (VAH), Value Area Low (VAL), and the Value Area itself, which by default covers 70% of total tick volume.
The profile is displayed visually on the chart with options to show a histogram, estimated POC, VAH, VAL lines, value-area shading, and compact labels. A panel provides summary information in three modes (Full, Compact, Minimal) detailing profile parameters and volume data. The indicator uses broker tick-volume data only and does not execute trades or provide trading signals. It serves as a manual visual tool to enhance market context understanding.