Opis
Jakie dane rynkowe analizuje
London Open Signal ładuje wieloletnią historię intraday przypisanego symbolu bezpośrednio od twojego brokera (rozdzielczość M15 lub H1, do wyboru) i rekonstruuje każdy miniony dzień handlowy w dwóch oknach: pełny zakres "dnia" (konfigurowalna godzina rozpoczęcia/zakończenia) oraz sama sesja londyńska (konfigurowalna godzina otwarcia/zamknięcia, według czasu serwera brokera). Dla każdej historycznej sesji symuluje dwa hipotetyczne transakcje — długą i krótką — używając stałego stopu i celu, wychodząc na zamknięciu sesji, jeśli żaden z nich nie zostanie osiągnięty, po uwzględnieniu spreadu i kosztów. Następnie testuje pięć prostych pomysłów względem tych wyników, aby sprawdzić, które, jeśli w ogóle, faktycznie przewidziały rezultat: aktualną serię wygranych/przegranych nocnych, dzień tygodnia, gdzie cena otwarcia sesji znajduje się w zakresie poprzedniego dnia, lukę względem zamknięcia poprzedniego dnia oraz czy zakres poprzedniego dnia był wyjątkowo szeroki lub wąski.
Jak interpretować sygnały i elementy wizualne
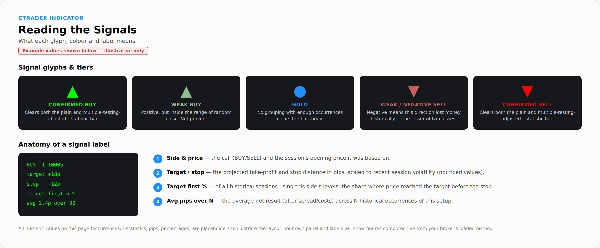
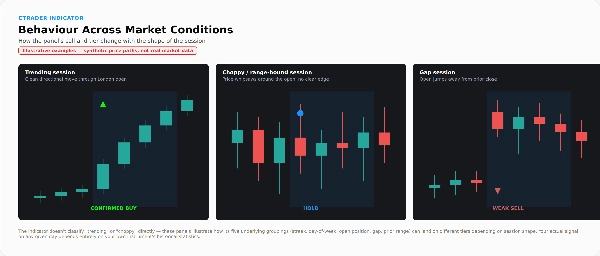
Zielona strzałka w górę oznacza sygnał Kupna na otwarciu Londynu tego dnia; czerwona strzałka w dół oznacza Sprzedaż; niebieska kropka oznacza Trzymaj (nie znaleziono uzasadnionej przewagi). Te historyczne strzałki są obliczane metodą walk-forward — każda używa tylko danych dostępnych przed danym dniem, nigdy wyniku samego dnia.
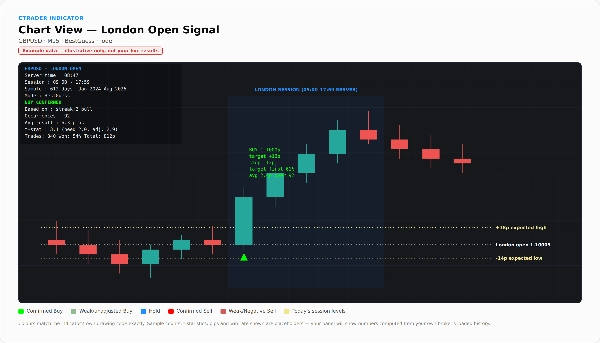
Panel na wykresie (w lewym górnym rogu) pokazuje dzisiejszy sygnał i etykietę poziomu: POTWIERDZONY, POTWIERDZONY (niekorygowany), SŁABY lub NEGATYWNY. Informuje to, jak bardzo można ufać strzałce — SŁABY oznacza, że pozorna przewaga mieści się w zakresie losowego szumu, a NEGATYWNY oznacza, że ten kierunek historycznie przyniósł stratę, a strzałka to tylko mniejsze z dwóch strat. Panel pokazuje też, na jakiej grupie opiera się sygnał, ile razy się pojawił, średni wynik, statystykę t względem progu zwykłego i skorygowanego na wielokrotne testy oraz — co najważniejsze — bieżący wynik walk-forward: ile transakcji narzędzie faktycznie by wykonało, wskaźnik wygranych, łączną liczbę pipsów, pipsy na transakcję oraz najgorszy spadek kapitału. Jeśli ten wynik jest płaski lub ujemny, panel informuje o tym bezpośrednio.
Trzy opcjonalne nakładki dodają szczegóły: pełna tabela wyników (każda testowana grupa, z wielkością próby i statystyką t dla obu kierunków), "laboratorium stop/target", które pokazuje, jak zmienia się wskaźnik wygranych wyłącznie w zależności od ustawienia stopu i celu — aby pokazać, że wysoki wskaźnik wygranych nie jest tym samym co prawdziwa przewaga — oraz pole poziomów sesji pokazujące typowy rozmiar ruchu w górę, w dół i całkowity zakres sesji londyńskiej na medianie/75. i 90. percentylu. Przerywane linie na dzisiejszej sesji oznaczają otwarcie oraz oczekiwany wysoki/niski poziom skalowany przez zmienność.
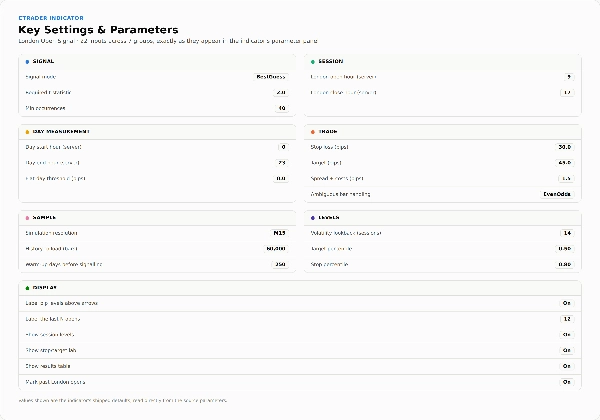
Kluczowe ustawienia i parametry
- Sygnał: Tryb (Tylko Potwierdzone vs Najlepsze Przypuszczenie), Wymagana statystyka t, Minimalna liczba wystąpień, aby grupa była brana pod uwagę
- Sesja: Godzina otwarcia Londynu, godzina zamknięcia Londynu (czas serwera brokera)
- Pomiar dnia: Godzina rozpoczęcia/zakończenia dnia, próg dnia płaskiego (pipsy)
- Transakcja: Stop loss (pipsy), Cel (pipsy), Uwzględnienie spreadu/kosztów (pipsy), Obsługa niejednoznacznych świec (Pesymistyczna / Równe szanse / Optymistyczna, dla świec dotykających zarówno stopu, jak i celu)
- Próbka: Rozdzielczość symulacji (H1/M15), Historia do załadowania (świece), Dni rozruchu przed rozpoczęciem sygnalizacji
- Poziomy: Okres zmienności (sesje), Percentyl celu, Percentyl stopu
- Wyświetlanie: Etykietuj strzałki / licznik etykiet, pokaż poziomy sesji, pokaż laboratorium stop-cel, pokaż tabelę wyników, oznacz przeszłe otwarcia Londynu
Typowe zastosowania i scenariusze handlowe
Sprawdzanie panelu przed otwarciem Londynu, aby zobaczyć aktualny sygnał, jego poziom oraz oczekiwany zakres sesji na dany dzień. Badanie, czy jakiś prosty, interpretowalny wzór utrzymał się statystycznie dla danej pary na przestrzeni jej historii — i uczciwe sprawdzenie, czy wzór przetrwał korektę za testowanie wielu pomysłów naraz. Wykorzystanie prognoz poziomów sesji (oczekiwany wysoki/niski) do planowania celów lub stopów niezależnie od samego sygnału kupna/sprzedaży. Nie jest przeznaczony do automatycznego, bezobsługowego wykonywania transakcji — to wskaźnik, nie cBot, i nigdy sam nie otwiera pozycji.
Dla kogo jest to najlepsze
Dla traderów, którzy chcą zobaczyć faktyczny, zweryfikowany metodą walk-forward rekord sygnału, zamiast ufać twierdzeniom na słowo, i którzy potrafią czytać statystykę t oraz liczbę spadku kapitału obok strzałki. Dla dyskrecjonalnych traderów sesji londyńskiej, którzy cenią kontekst zakresu sesji nawet, gdy decydują się zignorować sygnał kupna/sprzedaży. Narzędzie celowo nie jest stworzone dla osób szukających systemu "podłącz i graj" — samo ocenia swoje sygnały i jasno powie, gdy liczby nie wspierają ich handlu.
Ważne ograniczenia i uwagi dotyczące użytkowania
- Wydajność jest obliczana na żywo na podstawie historii brokera faktycznie załadowanej podczas działania wskaźnika — nie jest to stały, wstępnie wygenerowany plik backtestu, więc wyniki mogą się różnić w zależności od brokera/konta i wymagają wystarczającej ilości załadowanej historii (zwiększ "Historia do załadowania", jeśli panel zgłasza za mało danych).
- Korekta na wielokrotne testowanie jest heurystyczna, nie gwarantowana — skorygowany próg zmniejsza, ale nie eliminuje, szansę, że wynik wygląda na istotny tylko przez przypadek.
- Testowane pięć pomysłów to proste, jednoczynnikowe klasyfikatory, sprawdzane niezależnie, a nie łączone — celowy wybór, aby narzędzie było interpretowalne i uniknąć dalszego ryzyka przeuczenia.
- W trybie Najlepszego Przypuszczenia wskaźnik zawsze pokazuje kierunek, włącznie z sygnałami o poziomie NEGATYWNYM — zawsze czytaj etykietę poziomu, nie tylko strzałkę.
- Symulowane realizacje stop/target używają uproszczonych założeń dla świec dotykających obu poziomów w tym samym świeczniku; rzeczywiste wykonanie może się różnić.
- Czysto oparte na cenie/statystyce — bez danych o wiadomościach, fundamentach czy innych aktywach.
- Wyłącznie wizualne i analityczne; nie wykonuje transakcji.
Podsumowanie
The indicator tests five simple, independent factors—overnight streak, day of the week, opening price position within the previous day’s range, gap size, and previous day’s range width—to identify statistically significant edges. Signals are displayed as arrows on the chart: green for Buy, red for Sell, and blue for Hold, with a tier label (CONFIRMED, WEAK, NEGATIVE) indicating the confidence level based on walk-forward testing.
A panel shows detailed statistics including win rate, total pips, t-statistics, and drawdown, updated live from broker data. Optional overlays provide a full results table, stop/target sensitivity analysis, and session-level range projections. The tool is purely analytical and visual; it does not execute trades and is intended for traders comfortable interpreting statistical metrics alongside signals.