


Opis
Rigid Volume Profile dzieli twoje okno retrospektywne na stałą liczbę poziomów cenowych i pokazuje, ile wolumenu zostało na każdym z nich wyhandlowane, rozdzielając na presję kupna i sprzedaży.
CO RYSUJE
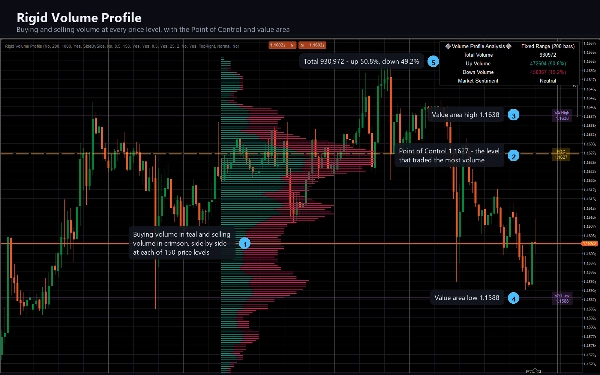
Poziomy histogram obok ruchu cenowego, zbudowany z ostatnich N świec. Pasek każdego poziomu jest podzielony na wolumen byczy (ze świec, które zamknęły się wzrostem) i niedźwiedzi (ze świec, które zamknęły się spadkiem), dzięki czemu możesz zobaczyć nie tylko gdzie miały miejsce transakcje, ale która strona je realizowała. Świece zamknięte bez zmiany dzielą swój wolumen równomiernie między obie strony.
Przerywana linia Point of Control oznacza poziom cenowy, na którym wyhandlowano najwięcej wolumenu w oknie, oznaczony jego dokładną ceną.
Dwie linie obszaru wartości ograniczają poziomy, które odpowiadają za 70% wolumenu w oknie, każda oznaczona.
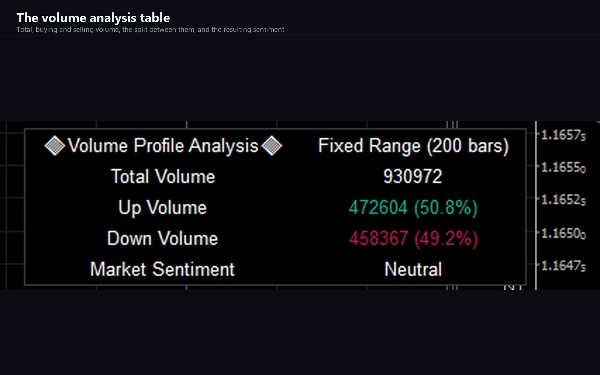
Tabela analizy wolumenu raportuje wolumen całkowity, wzrostowy i spadkowy z procentami oraz odczyt nastroju oparty na dominującej stronie.
JAK GO UŻYWAĆ
Profile wolumenu opisują, gdzie faktycznie miały miejsce transakcje, a nie gdzie tylko poruszała się cena. Poziom, który pochłonął dużo wolumenu, to poziom, na którym zależy wielu uczestnikom; cienka część profilu to zakres cenowy, przez który rynek przeszedł szybko.
Odczytuj Point of Control jako środek ciężkości okna. Odczytuj obszar wartości jako zakres, w którym dokonano większości transakcji. Odczytuj cienką przerwę między dwoma ciężkimi węzłami jako strefę, przez którą cena ma tendencję przechodzić, a nie zatrzymywać się. Obserwuj, która strona podziału dominuje na poziomie, gdy cena do niego wraca.
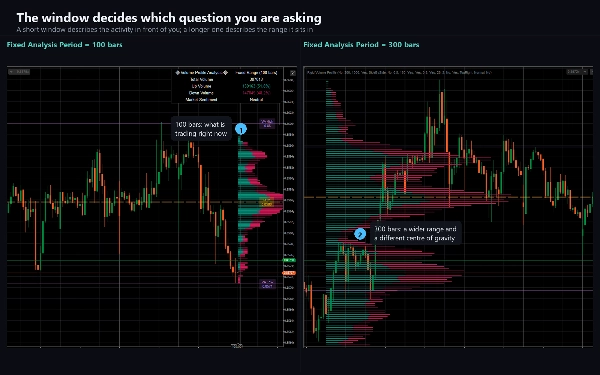
Okno wybierasz sam, a obraz zmienia się wraz z nim, więc wybierz okres retrospektywny odpowiadający decyzji, którą podejmujesz. Profil 100 świec odpowiada na inne pytanie niż profil 500 świec.
KLUCZOWE USTAWIENIA
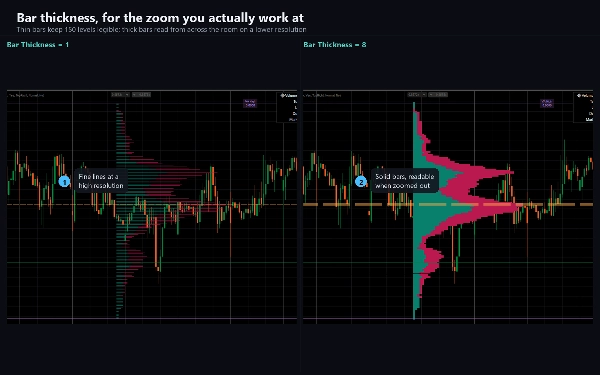
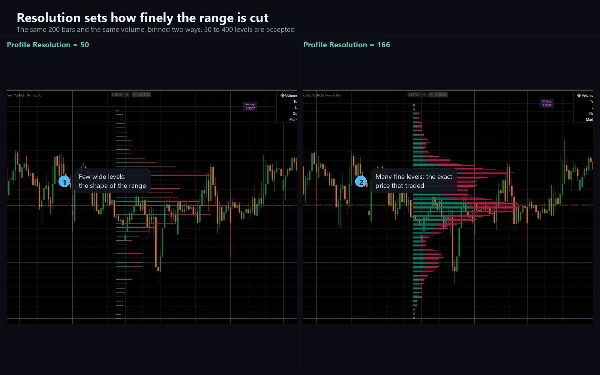
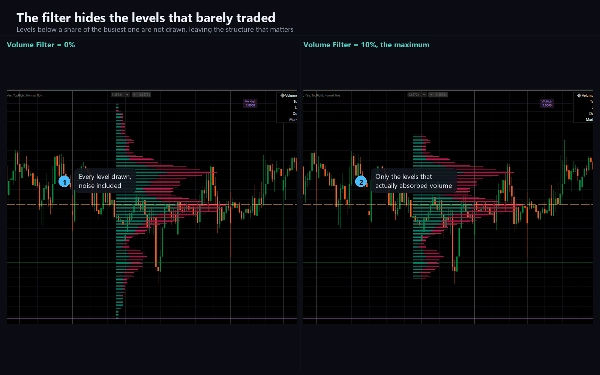
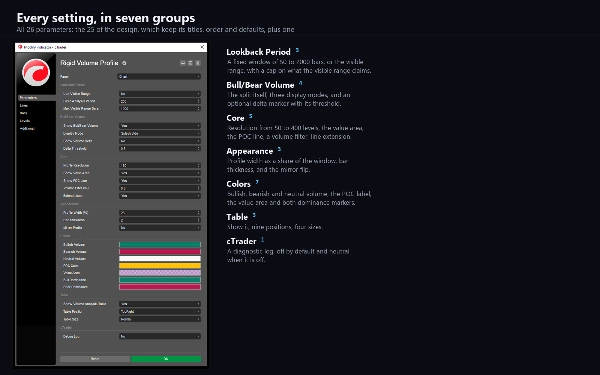
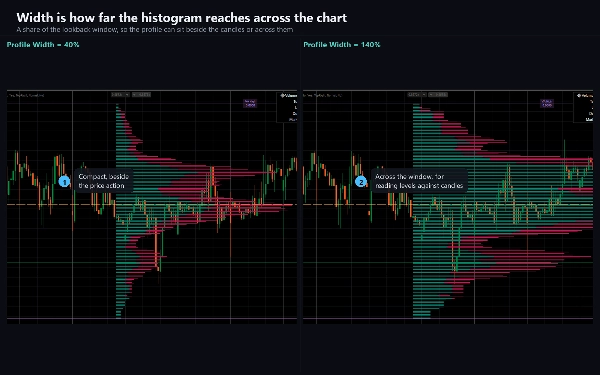
Fixed Analysis Period ustawia okres retrospektywny w świecach, od 50 do 2000. Profile Resolution ustawia, na ile poziomów cenowych dzieli się zakres, od 50 do 400; mniej poziomów czyta się jak klasyczny profil, więcej daje szczegółowe dane. Display Mode oferuje Side by Side, Stacked i Split. Profile Width skaluje histogram jako procent okresu retrospektywnego. Volume Filter ukrywa poziomy poniżej procentu najruchliwszego. Show Volume Delta dodaje znacznik tam, gdzie jedna strona wyraźnie dominuje. Każdy kolor jest regulowany, a tabela analizy może być przesunięta do dowolnej z dziewięciu pozycji lub wyłączona.
Use Visible Range przełącza okres retrospektywny na świece aktualnie widoczne na ekranie zamiast stałej liczby.
TYP WSKAŹNIKA I OKNO
Nakładka na wykres. Rysuje się na samym wykresie cenowym, nie w osobnym panelu.
INTERWAŁY CZASOWE I INSTRUMENTY
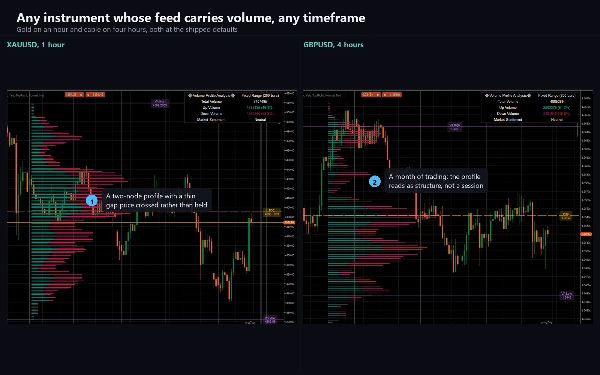
Dowolny interwał czasowy. Najbardziej przydatny intraday, od M5 do H4, gdzie rozkład wolumenu sesji jest znaczącym obiektem.
Działa na każdym instrumencie, którego feed zawiera wolumen. Na rynku forex jest to wolumen tickowy, liczba aktualizacji cen na świecę, co jest wskaźnikiem aktywności, a nie wielkości transakcji. Na indeksach i CFD na towary niektórzy brokerzy dostarczają rzeczywisty wolumen giełdowy, a profil jest tam bardziej znaczący. Na instrumencie bez wolumenu nic nie jest rysowane.
DLA KOGO JEST
Traderzy, którzy już pracują z profilami wolumenu i chcą mieć profil z regulowaną stałą siatką i wyraźnym podziałem na kupno i sprzedaż, zamiast stałego profilu sesji.
WERSJA DEMONSTRACYJNA
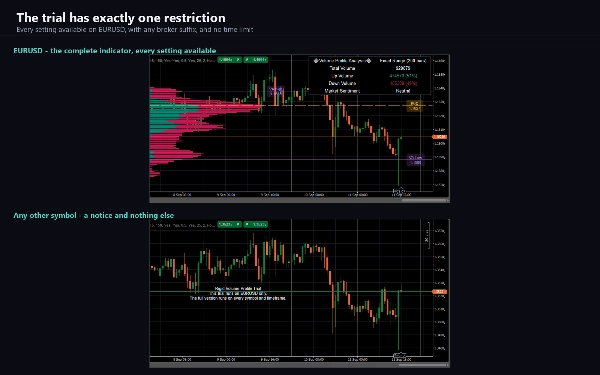
Do tego produktu dołączona jest wersja demonstracyjna. To pełny wskaźnik ze wszystkimi dostępnymi ustawieniami, ograniczony do EURUSD. Pełna wersja usuwa to ograniczenie i nic więcej nie dodaje.
NOTATKI TECHNICZNE I OGRANICZENIA
Profil jest przeliczany na każdym ticku formującej się świecy, więc Point of Control i obszar wartości przesuwają się w trakcie świecy i ustalają po jej zamknięciu. To jest celowe. Nic tutaj nie jest sygnałem zamkniętej świecy.
Przy Profile Resolution powyżej 166 najniższe poziomy cenowe nie są rysowane. To celowe ograniczenie projektu, który rezerwuje stałą pulę obiektów rysunkowych i używa trzech na poziom cenowy; przełączniki Show POC Line i Show Value Area zwalniają każdy po jednym. Trzymaj Profile Resolution na 166 lub mniej, aby zobaczyć pełny profil.
Obszar wartości jest budowany przez uszeregowanie poziomów według wolumenu i branie ich w tej kolejności, aż osiągnięte zostanie 70%, a następnie raportowanie najwyższej i najniższej ceny spośród nich. Dlatego zwykle jest szerszy niż obszar wartości budowany przez rozszerzanie się od Point of Control.
Ponieważ profil jest budowany na podstawie wolumenu twojego brokera, dwóch brokerów nie wygeneruje identycznego profilu z tego samego rynku.
AccessRights to None: wskaźnik nie składa zleceń, nic nie modyfikuje i nie odczytuje danych konta.
WSPARCIE
Dokumentacja obejmująca każdy parametr, ustawienia, które zaskakują użytkowników, oraz przewodnik rozwiązywania problemów jest dołączona do produktu. Pytania są mile widziane przez zakładkę Dyskusja; przydatny raport zawiera nazwę symbolu, brokera, interwał czasowy, wersję cTrader i zmienione ustawienia względem domyślnych.
Trading wiąże się z ryzykiem. Wyniki historyczne nie gwarantują przyszłych rezultatów.
Podsumowanie
Users can customize the lookback period (50 to 2000 bars), profile resolution (50 to 400 levels), display mode (side by side, stacked, split), profile width, and volume filtering. The profile updates dynamically on every tick of the forming bar. It supports any timeframe and instruments with volume data, including tick volume for forex and real exchange volume for some CFDs. The indicator is intended for traders familiar with volume profiles seeking detailed buying and selling pressure insights on a fixed grid rather than session-based profiles. A trial version is available with full features restricted to EURUSD.



















![Logo „[Hamster-Coder] Pivot Points MTF”](https://cdn.ctrader.com/image/webp/4c143e5a-309c-40e3-a578-f04d1e133ffa_31159)









