SymbolTFOverlay
Indicator
119 downloads
Version 1.0, Sep 2025
Windows, Mac
Description
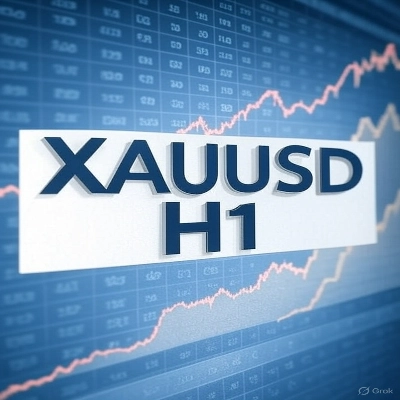
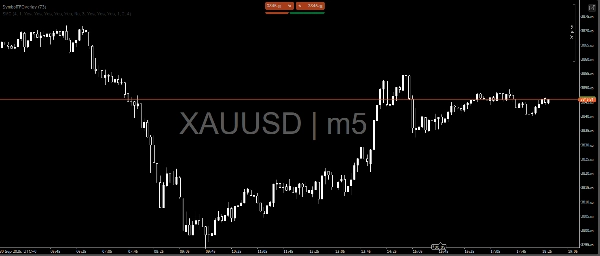
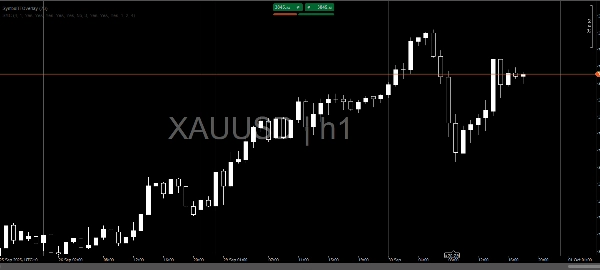
The SymbolTFOverlay is a custom indicator for the cTrader platform, designed to display the current symbol (e.g., EURUSD) and timeframe (e.g., H1) as a semi-transparent text overlay on the chart. This indicator enhances chart readability by providing a clear, centralized visual reference for key market information.Key Features:
- Dynamic Text Display: Shows the symbol and timeframe (e.g., "EURUSD | H1") in the center of the visible chart area.
- Automatic Updates: Refreshes the text whenever a new bar is formed, ensuring it remains centered.
- Customizable Appearance: Font size, color and transparency of the text can be freely customized.
- Efficient Monitoring: Utilizes a timer (checking every 2 seconds) to detect changes in the chart's visible area, such as zooming or scrolling, for seamless text repositioning.
- Robust Validation: Includes checks to prevent errors from invalid indices or price levels, ensuring reliable performance across different market conditions.
- Overlay Design: Renders the text directly on the chart without cluttering it, maintaining a clean visual experience.
The indicator is ideal for traders who need quick access to the symbol and timeframe information while analyzing charts, with automatic adjustments to maintain optimal visibility during dynamic chart interactions.
Summary
AI summary
SymbolTFOverlay is a custom indicator for the cTrader platform that displays the current trading symbol and timeframe as a semi-transparent text overlay centered on the chart. It dynamically updates the displayed text with each new bar formation to ensure accuracy. The indicator automatically repositions the overlay during chart interactions such as zooming or scrolling by checking the visible area every two seconds. Users can customize the font size, color, and transparency of the text to suit their preferences. Built-in validation prevents errors from invalid data, supporting reliable performance across various market conditions. The overlay design integrates the information directly on the chart without cluttering the visual space, enhancing chart readability. This indicator supports multiple market types including Forex, Indices, Commodities, Crypto, and Stocks. It is intended for traders who require immediate, clear reference to the current symbol and timeframe during technical analysis.
Indicator profile
Customer reviews
0.0
Reviews: 0
Customer reviews
No reviews for this product yet. Already tried it? Be the first to tell others!
Discussion
FAQ
Forex
Indices
Commodities
Crypto
Stocks
Products available through cTrader Store, including trading bots, indicators and plugins, are provided by third-party developers and made available for informational and technical access purposes only. cTrader Store is not a broker and does not provide investment advice, personal recommendations or any guarantee of future performance.


Price
Since 26/09/2025
119
Free installs