"SpreadGuard  Cost  Spread Overlay" logo
SpreadGuard Cost Spread Overlay
"SpreadGuard  Cost  Spread Overlay" uploaded image
Since 02/01/2026

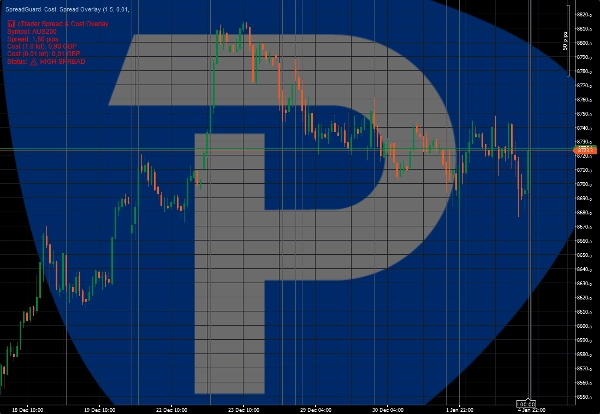
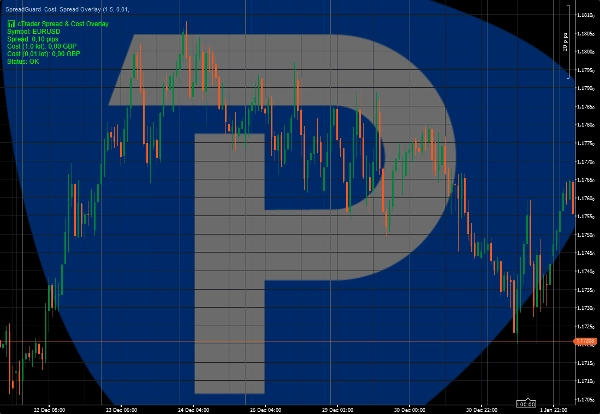
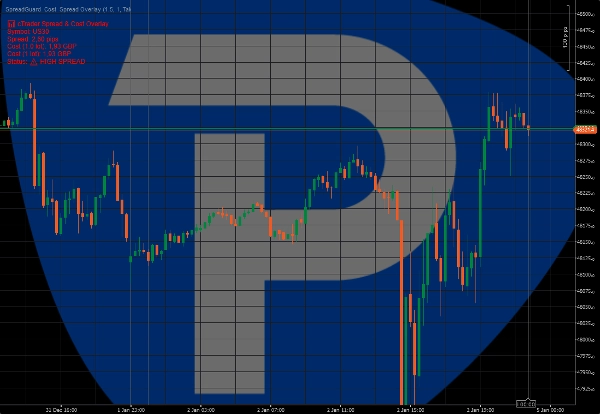
cTrader Spread & Cost Overlay is a lightweight indicator designed to visualize real-time trading costs directly on the chart.

The indicator shows the current spread in pips and calculates the estimated cost of a trade based on the selected lot size. A visual warning highlights periods of high spread, helping traders avoid unfavorable execution conditions.

Key features:
• Live spread display (pips)
• Estimated trade cost for selected lot size
• Visual warning when spread exceeds a defined threshold
• Clean on-chart overlay

This indicator does not place trades or generate trading signals.
It is intended as an execution and risk-awareness tool for manual traders.

Suitable for scalpers, intraday traders, and prop firm accounts.

*Early access price. Future updates may be released at a higher regular price.

Indicator profile
0.0
Reviews: 0
Customer reviews
No reviews for this product yet. Already tried it? Be the first to tell others!
Prop
Forex
EURUSD
ATR
GBPUSD
Products available through cTrader Store, including trading bots, indicators and plugins, are provided by third-party developers and made available for informational and technical access purposes only. cTrader Store is not a broker and does not provide investment advice, personal recommendations or any guarantee of future performance.

More from this author

Visual session structure showing Asia, London and New York high/low ranges directly on the chart.
Visual warning zones for high-impact news so you can manage risk before volatility hits.

You may also like

MACD Indicator with Histogram that plots Colors Based on Direction Above and Below the Zero Line.
Square Matrix Trading System by LudwigICT – Institutional-Grade Trading Clarity in cTrader
Stochastic Confluence Pro (RSI + Divergence)
Bring the RMA to cTrader! This is the Relative Moving Average from TradingView.
Professional ZigZag Fibonacci tracer. Automated institutional level detection with dynamic market structure mapping.
Fear & Greed Index: 4 configurable components (momentum, volatility, strength, pattern) with 6 calculation methods each
Precision SMC tool with HTF sweeps, MSS confirmation & smart FVG detection for high-probability reversals.
Volume Meter
Identify 34 candlestick patterns, track trends across timeframes, and get instant alerts with this powerful trading tool
Plots automatic psychological levels at round-number zones – major structure & liquidity levels.
Advanced RSI: Enhanced algorithm, signal line, smart colors, shaded zones, 4 MA types - Superior accuracy for pro tradin
⚡ THOR SIGNAL spots premium setups with sniper precision for smarter, cleaner trades.
UT BOT Rewrited.
Provides comprehensive trend and momentum analysis by combining EMAs, RoC, normalized ATR, RSI, and volume..
Detecting reversal zones + multidimensional mapping of support and resistance "Golden Levels.
🚨Detection of geometric price patterns (Harmonic Patterns) and market structures based on price action📈
Custom KAMA Indicator – Optimized for Speed and Precision
1 Candel High Time Freme
Since 02/01/2026