"Volumen Profil" logo
Volumen Profil
"Volumen Profil" uploaded image
Since 30/03/2025
About trial version
“Trial version expires 7 days after first activation. After expiration, the indicator stops displaying profiles and only shows an expiry message.”

🚀 Volume Profile Pro for cTrader

Unlock the true structure behind price action with Volume Profile Pro, a powerful and fully customizable Volume-by-Price indicator designed specifically for professional cTrader traders.

This advanced tool visualizes individual volume profiles per selected timeframe period, allowing you to see exactly where institutional activity is concentrated — directly inside your chart.


🔎 What It Does

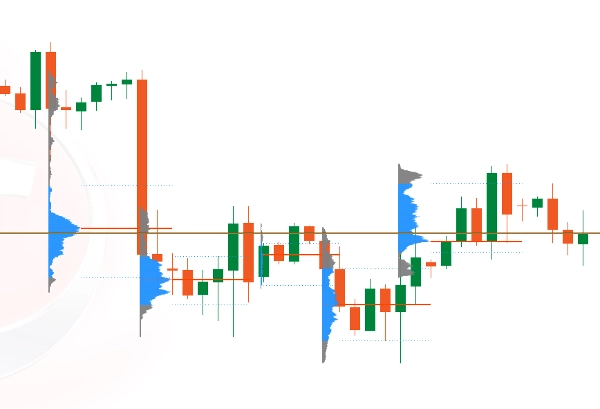
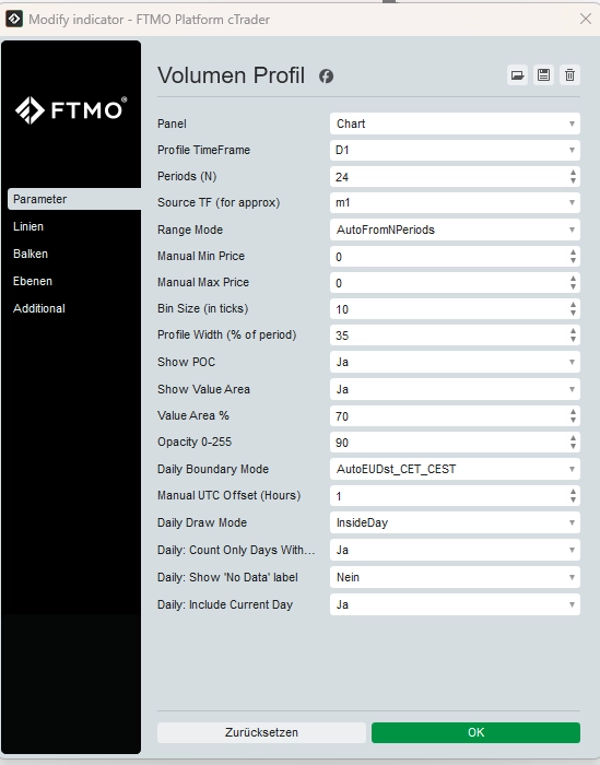
Volume Profile Pro calculates and displays fixed-range volume distribution for each completed period (H1, M15, D1, etc.), plotted directly on the price axis for precise structural analysis.

Each profile:

  • Is drawn individually per period
  • Uses a consistent fixed price range
  • Displays volume distribution per price level
  • Highlights key institutional levels

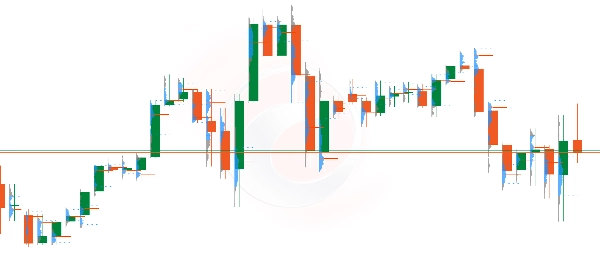
Profiles are positioned cleanly to the left of each candle, ensuring clear structure recognition without obstructing price action.


⚡ Key Features

✔ Individual volume profiles per timeframe period
✔ Selectable profile timeframe (M15, H1, H4, D1, etc.)
✔ Fixed price range (automatic or manual)
✔ Point of Control (POC) highlighting
✔ Value Area High (VAH) & Value Area Low (VAL)
✔ Smooth rendering without chart flickering
✔ Fully optimized for performance
✔ Designed for CFD and Tick Volume environments


📊 Why Traders Use It

  • Identify institutional accumulation & distribution zones
  • Spot high-probability reaction levels
  • Confirm breakout strength
  • Refine entries inside consolidation ranges
  • Align volume structure with price action

Whether you're a scalper, intraday trader, or swing trader, Volume Profile Pro gives you a structural edge.


⚠ Important Disclaimer

The Volume Profile is a trading software tool and does not constitute financial or investment advice.

Trading Forex, CFDs, and other financial instruments involves substantial risk and may result in the loss of capital.


🎯 Built for Precision. Designed for Professionals.

Take your market structure analysis to the next level and trade with clarity, confidence, and control.

About trial version
“Trial version expires 7 days after first activation. After expiration, the indicator stops displaying profiles and only shows an expiry message.”
Indicator profile
0.0
Reviews: 0
Customer reviews
No reviews for this product yet. Already tried it? Be the first to tell others!
Forex
Indices
Products available through cTrader Store, including trading bots, indicators and plugins, are provided by third-party developers and made available for informational and technical access purposes only. cTrader Store is not a broker and does not provide investment advice, personal recommendations or any guarantee of future performance.

More from this author

Multi-timeframe Mean Reversion & Gold trading CBot, optimized per symbol for consistent performance and controlled risk.
4
Profit factor
0.46%
Max drawdown
Dual Bollinger Band cBot for cTrader delivering precise volatility signals and optimized trade entries.
55.7%
4
Profit factor
4.8%
Max drawdown

You may also like

L'indicatore UTBot è uno strumento di analisi tecnica che crea una linea di trailing stop dinamica basata sull'ATRT
3 bar triangle = high below 2 day high, low above 2 day low
🦅 AI Institutional System: Order Blocks, Volume Delta Profile, OrderFlow Limit Buy/Sell, MTF, psychology & reversal.
Sync vertical lines automatically between multiple charts of the same symbol. Mark once — see it everywhere. Ideal for m
don't move to the end of chart after timeframe changing. it should be better to use for near history. for long history
Pinpoint FVGs, track fills and see mitigation stats — trade imbalances with clarity and confidence.
Detect FVGs with age, status, Fibonacci levels, and customizable fill threshold—extended version.
Alerts you when price touches Fibonacci levels. Stay organized and trade efficiently!
Automatically plots Daily and Weekly Fibonacci retracements with smart redraw and session control.
Simple MACD Histogram with color-coded rising (green) and falling (red) momentum bars.
CandleColourFlow MultiFx - optimized to work on Fx Majors, Fx MInors, Fx Crosses
Automatic Wolfe Wave detection with full trade projection and performance dashboard for traders.
Multi-Timeframe Rolling Volatility Indicator - Smart Volatility Breakout System
volumen perfile
Structural analysis framework designed to quantify swing point behavior at psychological price levels
🔥 THIS BURNS JP225 INDICATOR – Professional Trading Signals
Indicatore di volatilità che filtra quando le bande di Bollinger sono in espansione
Visualize Asia session range with customizable lines for high, low, mid, start, and end.
Since 30/03/2025