Description
PROPFOLIO MASTER SUITE: INSTRUCTION MANUAL
Platform: cTrader Version: 1.0 (Store-Compliant Edition) Powered by: Propfolio Solutions
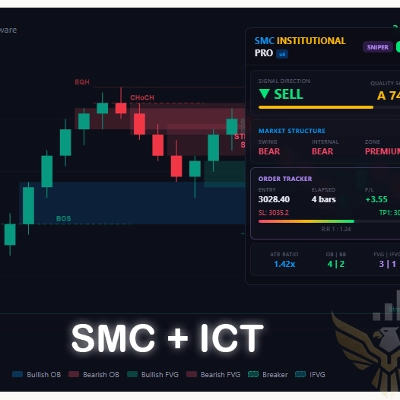
Welcome to the PropFolio Peak Formation SMC Dashboard. This is a complete institutional charting suite designed to bring Smart Money Concepts (SMC), Beat The Market Maker (BTMM) tracking, and Volume Profile analysis into one lightweight, highly optimized cTrader indicator.
📥 1. INSTALLATION GUIDE
- Download the
PropFolioPeakFormationSMCDashbaord.algofile. - Double-click the
.algofile. cTrader will automatically open and install it. - Open any chart in cTrader.
- Right-click the chart -> Indicators -> Custom -> Select PropFolioPeakFormationSMCDashbaord.
- Click OK to apply.
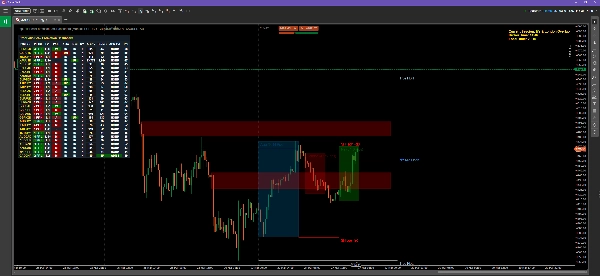
📊 2. THE DASHBOARD EXPLAINED
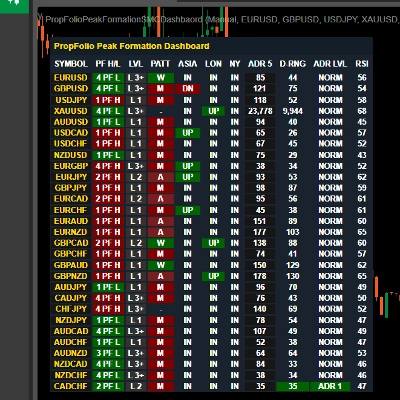
The suite features a multi-symbol dashboard that tracks institutional market states across 11 columns in real-time.
- SYMBOL: The currency pair being tracked. You can define a custom list in the indicator settings.
- PF H/L (Peak Formation): Shows whether the current 5-day cycle is in a Peak Formation High (PFH) or Peak Formation Low (PFL), and how many days ago it formed.
- LVL (Level): The current BTMM cycle level (Level 1, Level 2, or Level 3+).
- PATT (Pattern): Identifies intra-day institutional patterns.
- M / W: Standard M and W formations.
- A / V: A-Tops and V-Bottoms.
- ASIA / LON / NY: Shows the current price state relative to that specific session's range.
- UP (Green): Price has broken above the session high.
- DN (Red): Price has broken below the session low.
- IN (Grey): Price is ranging inside the session box.
- ADR 5: The Average Daily Range over the last 5 days (in pips).
- D-RNG: The current Day's Range (in pips).
- ADR LVL: Shows if the current day has exhausted its ADR.
- NORM: Normal range.
- ADR 1 / 2 / 3: Price has pushed 1x, 2x, or 3x beyond its normal daily volume (Expect exhaustion/reversals).
- RSI: 15-Minute RSI to quickly spot overbought (Red) or oversold (Green) conditions.
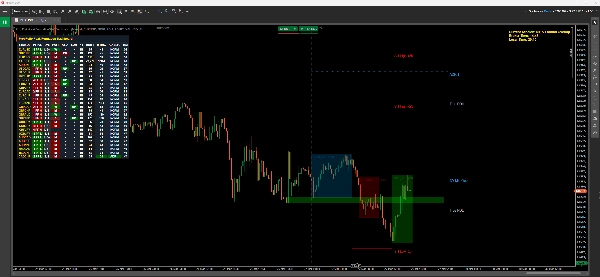
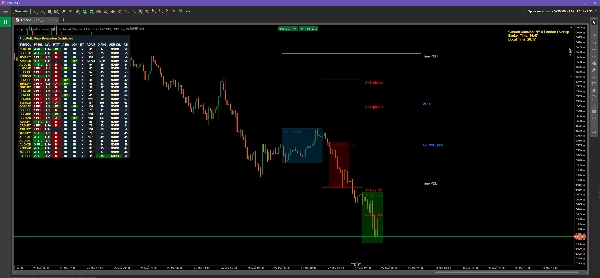
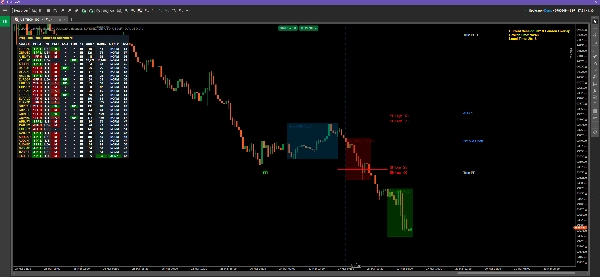
👁️ 3. CHART VISUALS & SMC TOOLS
1. Killzones (Liquidity Boxes) The indicator automatically draws transparent boxes for the Asian, London, and New York sessions. The pip-size of each box is labeled at the bottom.
2. Stop Hunt Lines (BTMM) Lines are drawn 25 and 50 pips above and below the Asian Session box. These are institutional targets where market makers hunt retail stop losses before reversing the trend.
3. True PDH & PDL Silver lines mark the True Previous Day High and Previous Day Low, calculated strictly from the True Asia Open to True NY Close (ignoring dead rollover volume).
4. Supply & Demand (S&D) The engine scans the last 150 candles for institutional imbalance.
- Red Boxes: Unmitigated Supply (Sell zones).
- Green Boxes: Unmitigated Demand (Buy zones).
- Note: Zones disappear once price completely mitigates (tests) them.
5. ADR Target Lines Based on the Peak Formation, the indicator projects Orange or Blue dashed lines marking the 1x, 2x, and 3x Average Daily Range exhaustion targets for the day.
📈 4. VOLUME PROFILE (Flexible vs. Fixed)
The indicator features a fully integrated Volume Profile engine to find the Point of Control (POC) and Value Area High/Low (VAH/VAL).
How to use FLEXIBLE Mode:
- In the indicator settings, ensure VP Mode is set to
Flexible. - Two vertical Aqua-colored dashed lines will appear on your chart.
- Simply click and drag these lines to outline any price action on your chart.
- The Volume Profile histogram, POC, and Value Area will instantly calculate and snap to the exact area between your two lines!
How to use FIXED Mode: Set the mode to FixedDaily. The profile will automatically calculate the volume for the current trading day without needing draggable lines.
⚙️ 5. TIME HUD & ALERTS
Advanced Time HUD In the top right corner, you will see a golden text display. This automatically calculates your broker's time, your local computer's time, and tells you exactly which trading session is currently active (e.g., "NY & London Overlap").
Terminal Alerts When a New Peak Formation occurs, a notification will be printed directly in your cTrader Automate -> Log tab so you never miss a setup. Note: For advanced external push notifications, please visit our Propfolio Solutions developer profile to learn about the expanded suite.
Summary
Customer reviews
5 | 100 % | |
4 | 0 % | |
3 | 0 % | |
2 | 0 % | |
1 | 0 % |