present
Sign up and get $50 off your first purchase
Trading product for CVD_Per-Bar Delta Indicator Volume, image 1
CVD_Per-Bar Delta
Indicator
Version 1.0, May 2026
Windows, Mac
Trading product for CVD_Per-Bar Delta Indicator Volume, image 2
Trading product for CVD_Per-Bar Delta Indicator Volume, image 3
Trading product for CVD_Per-Bar Delta Indicator Volume, image 4
Trading product for CVD_Per-Bar Delta Indicator Volume, image 5
Trading product for CVD_Per-Bar Delta Indicator Volume, image 6
Trading product for CVD_Per-Bar Delta Indicator Volume, image 7
Since 23/04/2026

Description

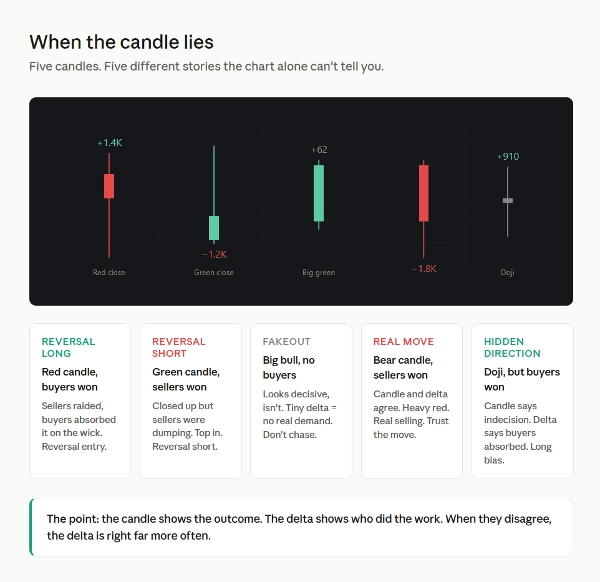
A candle shows you the outcome. It doesn't show you who did the work.

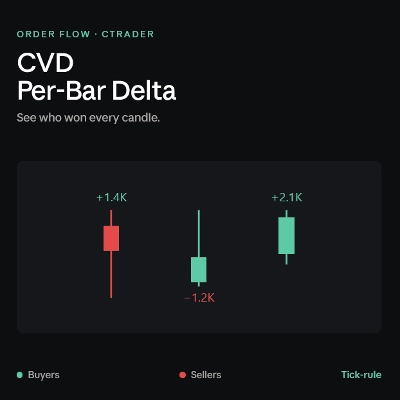
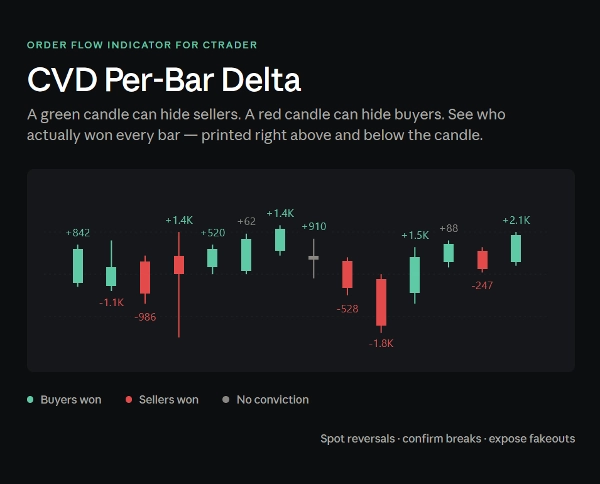
A bullish candle can close green while sellers were dumping into the rally. A bearish candle can close red while buyers absorbed every seller in the bar. A doji can hide a +900 delta of one-sided pressure. Price action alone can't tell you. Volume alone can't tell you. You need to know who won.

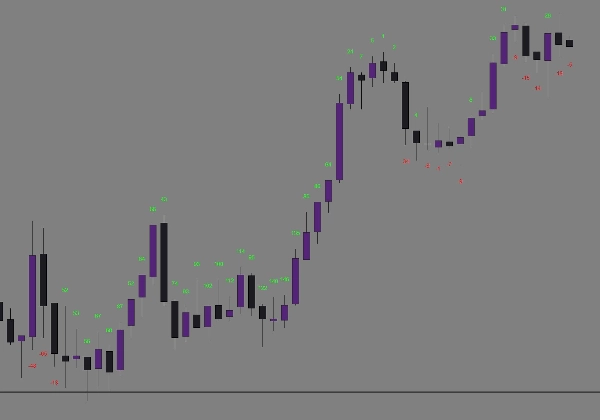
CVD Per-Bar Delta uses tick-rule classification on real cTrader tick data to count buyers vs sellers inside every candle, then prints the result directly on your chart as a colour-coded number. One glance and you know whether bulls or bears were in control β€” and by how much.

What you see:

  • A green number above buyer-dominated bars
  • A red number below seller-dominated bars
  • Number size scales with conviction β€” small numbers mean a fair fight, big numbers mean one side dominated

Where it earns its place:

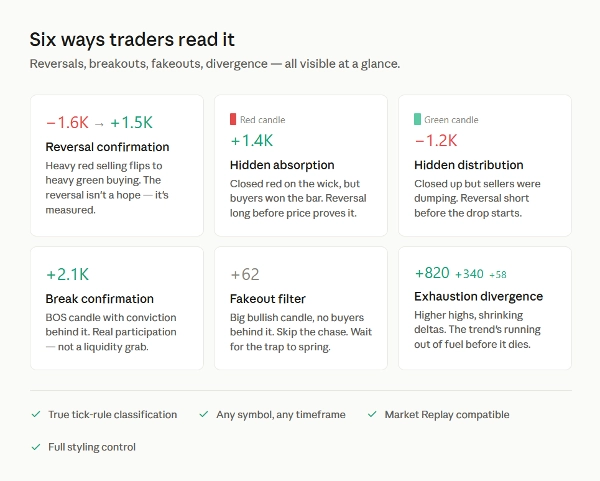
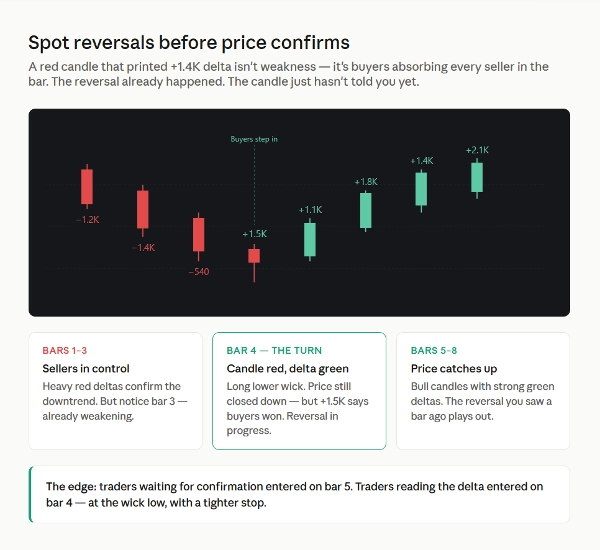
Reversal confirmation. A red candle that printed +1.4K delta isn't weakness β€” it's buyers absorbing every seller in the bar. The reversal already happened. The candle just hasn't told you yet. Enter at the wick low with a tight stop, while everyone else waits for the next candle to confirm.

Hidden absorption (long setups). Price spikes down into your support zone or order block. Long lower wick. Big green number. Buyers swallowed the raid. That's a high-probability reversal long β€” and the delta saw it before the candle closed.

Hidden distribution (short setups). Price grinds higher into resistance. Each green candle prints smaller delta than the last, then a green candle closes with a red delta. Buyers exhausted, sellers dumping into the rally. Top in. Short.

Break confirmation. A BOS candle with a strong delta in the break direction is real participation. Same break with a weak or opposite-coloured delta is a liquidity grab dressed as a breakout. Filter the fakeouts before you take them.

Exhaustion divergence. Price keeps making higher highs but the green deltas are getting smaller with each push. Buyers are running out of ammunition. The trend is dying before it dies.

Conviction filter. Two candles look identical on the chart. One has +850 delta. The other has +40. They are not the same candle. Skip the noise. Take the conviction bars.

Built for serious traders:

  • True tick-rule classification using cTrader's tick data β€” not synthetic OHLC approximation
  • Works on any symbol, any timeframe, any chart
  • Compatible with Market Replay for back-testing your read
  • Last 50 bars by default, fully configurable β€” zero clutter

Full styling control:

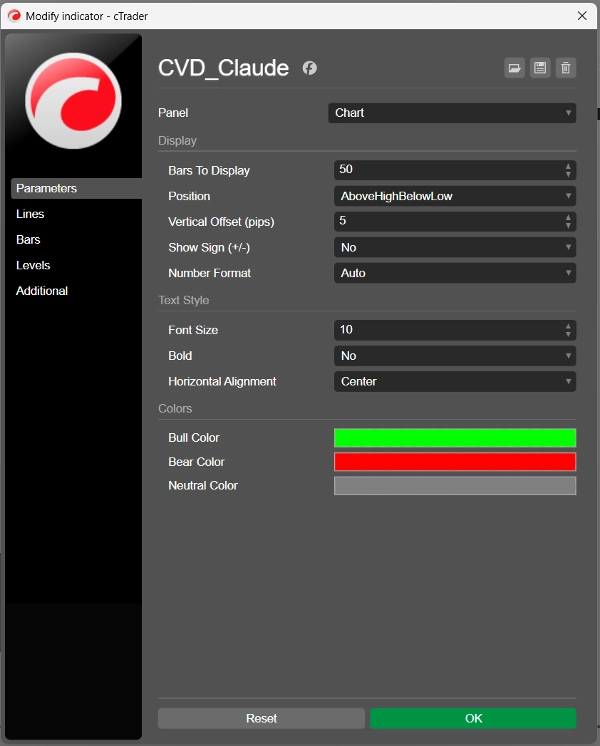
  • Position β€” above bar, below bar, or smart (above highs for bull bars, below lows for bear bars)
  • Text β€” font size 6 to 30, optional bold, alignment options
  • Colours β€” bull, bear and neutral pickers, match any chart theme
  • Format β€” raw numbers, K-thousands, or auto-switching
  • Display β€” adjustable pip offset, sign toggle, bar count

Important: This indicator requires tick data. Live charts use it automatically. For Market Replay, select "Tick data" when starting your replay session.

Pairs especially well with: order block / SMC strategies, reversal trading at key levels, breakout systems, mean-reversion setups, and any methodology that benefits from confirming intent behind a candle.

The chart shows you what happened. The delta shows you why.
Summary

Indicator profile
Indicator category
Volume
Output type
Visualisation
Data requirements
Tick data
Supported signals
Divergence

Discussion

Customer reviews

0.0
Reviews: 0
Customer reviews
No reviews for this product yet. Already tried it? Be the first to tell others!

FAQ

Volume
Products available through cTrader Store, including trading bots, indicators and plugins, are provided by third-party developers and made available for informational and technical access purposes only. cTrader Store is not a broker and does not provide investment advice, personal recommendations or any guarantee of future performance.

You may also like

Indicator
Imbalance
Fair Value Gap
+4
Fair Value Gap scanner with live fill telemetry, 50% CE lines, 4 mitigation rules, and a 3-stage native alert system.
Indicator
ZigZag Pro – Multi-Swing Indicator for cTrader Description: ZigZag Pro is a powerful and fully customizable swing indica
Indicator
AI
Forex
+7
Signal Strike is a professional trading indicator delivers clear, high‑confidence entry signals directly on your chart
Indicator
Supply & Demand
Support & Resistance
RAF Supply Demand Lite v1.0 automatically detects clean Supply and Demand zones using confirmed swing highs and lows. Zo
Indicator
ATR
Volume
+2
Nine timeframe cards, vivid candles, native BUY/SELL arrows and adjustable ATR-buffer stop-loss reference lines.
Indicator
Supertrend
Moving Average
Easy Trade: Trend & Breakout Indicator for cTrader
Indicator
AI
Forex
+3
Smart Money FVG & Imbalance Detector – Precision Institutional Tool
Indicator
ATR
Key Levels
+1
Explore 88 harmonic price-pattern variants with interactive chart controls and geometric reference levels.
Indicator
Volume
Key Levels
+1
Order book indicator .Don't trade against the flow. Trade with the truth!
Indicator
Signal
This Fair Value Gap (FVG) indicator is a technical analysis on multi-timeframe.
Indicator
ATR
BOS
+3
Fair Value Gaps with Multi-Timeframe.
Indicator
ATR
SMC
+15
Plot ATR-based SL and 1R/2R/3R TPs instantly for any trade, with clear R-multiple risk mapping.
Indicator
Signal
Fractal Arrow Buy and Sell Indicator
Indicator
ADX
ATR
+5
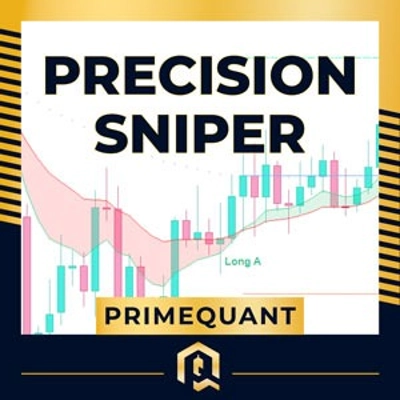
Precision Sniper by PrimeQuant: Advanced confluence engine with auto-presets, dynamic TP/SL, and live backtest stats.
Indicator
Key Levels
Liquidity Grab
+2
The levels you mark each morning, drawn and followed: PDH/PDL, weekly, monthly, sessions, equal highs/lows.
Indicator
Alpha Sentiment Pro - See the Market's Pulse Before It Moves
Indicator
Forex
Crypto
+5
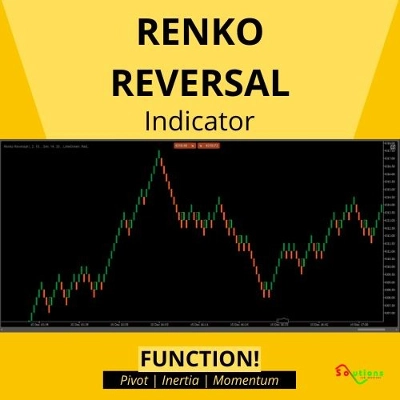
The best filter for trading trend continuations on Renko charts.
Indicator
SMC
Prop
+5
Automatically draws the Opening Range (High & Low) for Tokyo, London, and New York sessions. Configurable start times,

Price

Since 23/04/2026