
Description
📊 MultiTimeframe OHLC Indicator
Take your market analysis to the next level with the MultiTimeframe OHLC Indicator for cTrader 🚀
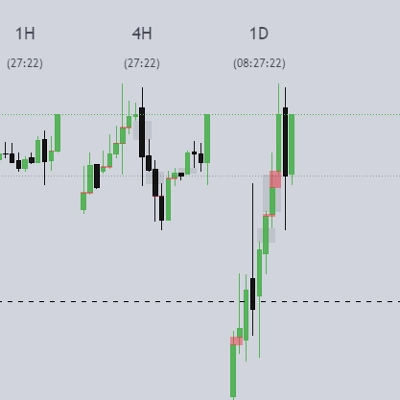
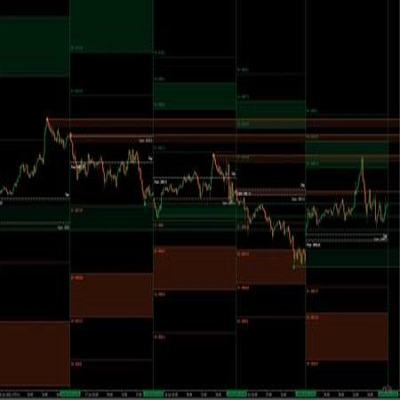
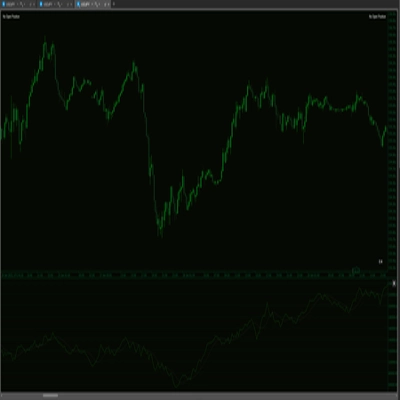
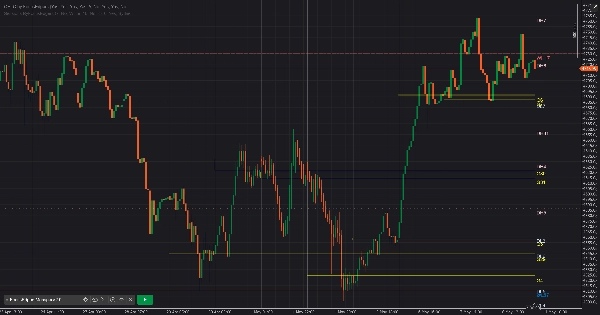
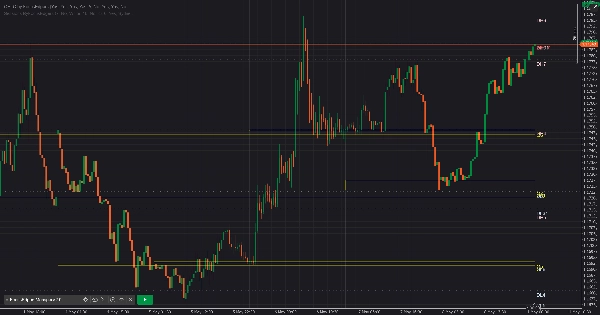
This powerful multi-timeframe tool displays key OHLC levels — Open, High, Low, Close — from multiple higher timeframes directly on your chart, helping traders identify critical price zones with clarity and precision. 🎯
✨ Features
🔹 Display OHLC levels from:
- Daily 📅
- Weekly 📈
- Monthly 🌙
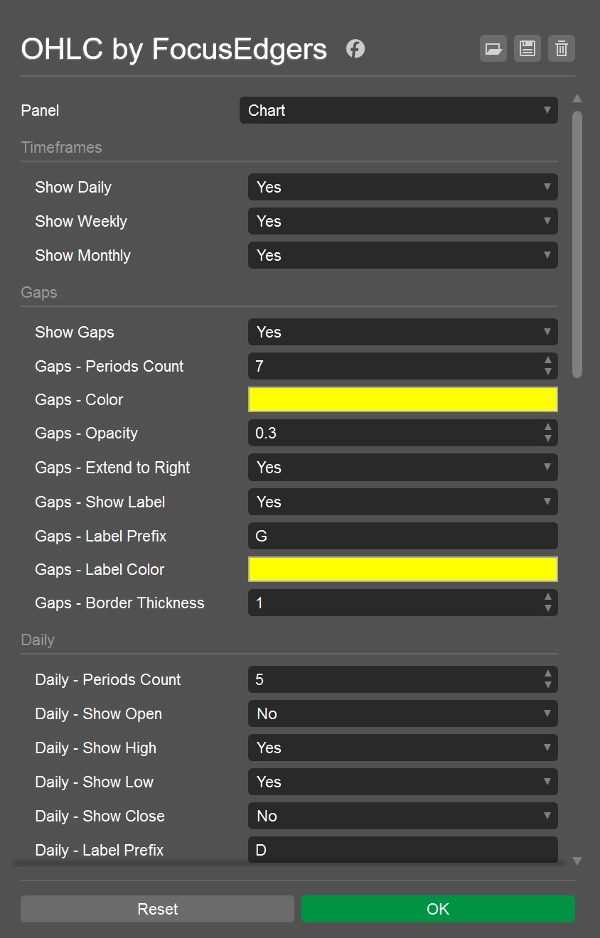
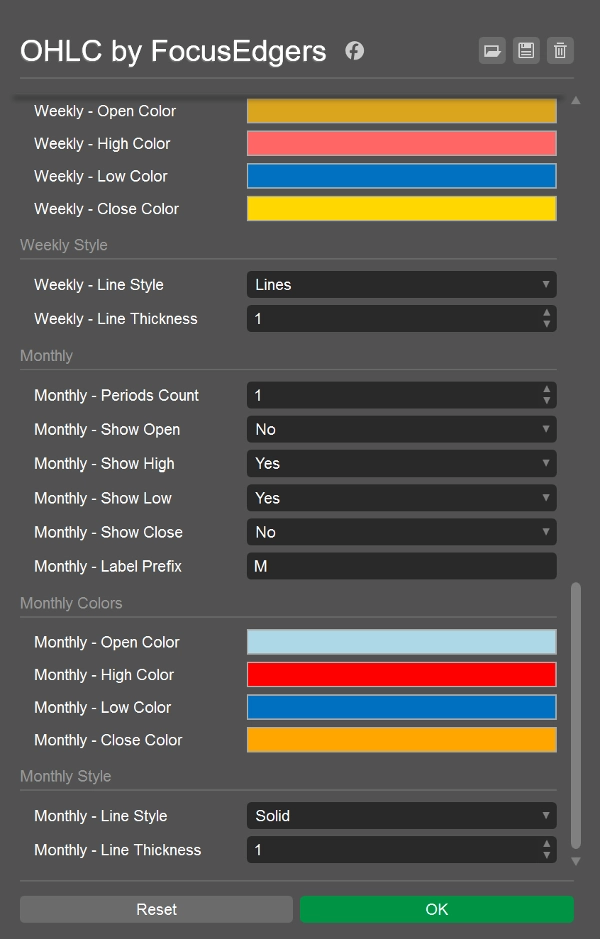
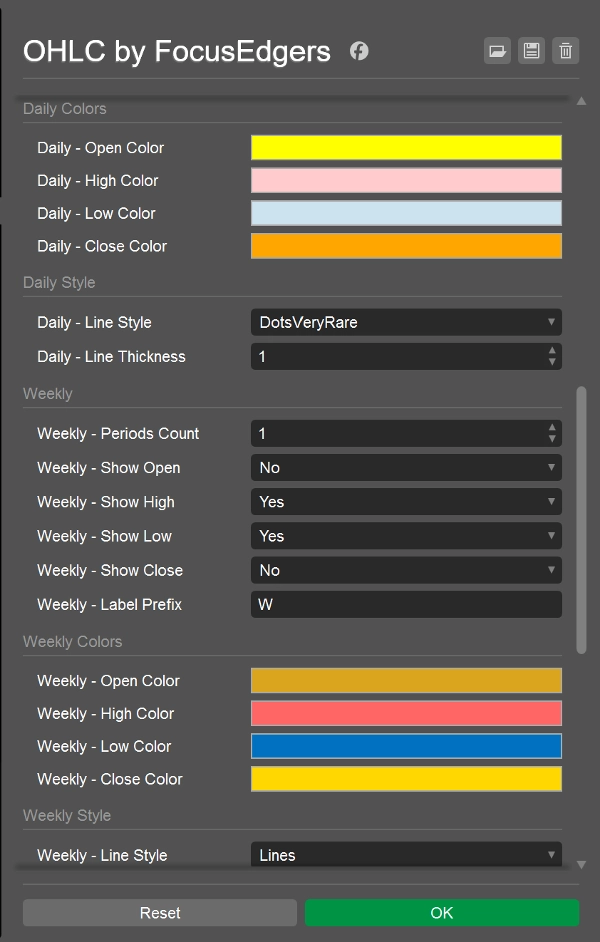
🔹 Fully customizable:
- Enable or disable each timeframe individually
- Show or hide Open / High / Low / Close levels independently
- Customize colors 🎨, line styles, thickness, and labels
🔹 Smart Gap Detection ⚡
- Automatically detects and highlights market gaps
- Adjustable opacity and border settings
- Optional labels for quick identification
🔹 Clean & Organized Visualization 🧠
- Clearly labeled levels for better chart readability
- Helps identify:
- Key support & resistance zones
- Liquidity areas
- Potential breakout setups 💥
- Institutional price levels
🔹 Optimized for Multi-Timeframe Analysis 📊
Perfect for scalpers, intraday traders, swing traders, and anyone using higher timeframe confluence in their strategy.
💡 Why Use This Indicator?
Markets often react around previous OHLC levels from higher timeframes. By visualizing these levels directly on your chart, you gain a deeper understanding of:
- Market structure
- Price reactions
- Momentum shifts
- Gap behavior
- Breakout and reversal opportunities
Whether you're trading Forex 💱, Indices 📉, Commodities 🪙, or Crypto 🪙, this indicator gives you an edge by keeping important levels visible at all times.
⚠️ Beta Version Notice
Please note that this indicator is currently in beta 🛠️ and is still under active development.
New features, optimizations, and improvements are continuously being added to enhance performance and usability.
Your feedback is highly appreciated ❤️
Happy Trading! 🚀