present
Sign up and get $50 off your first purchase
Trading product for ICTJudasSwing Indicator Fair Value Gap Key Levels, image 1
ICTJudasSwing
Indicator
Version 1.0, May 2026
Windows, Mac
Trading product for ICTJudasSwing Indicator Fair Value Gap Key Levels, image 2
Trading product for ICTJudasSwing Indicator Fair Value Gap Key Levels, image 3
Since 21/02/2025
466.3M
Traded volume
180.83K
Pips won
25
Sales
7.42K
Free installs

Description

ICT Asia Range Indicator

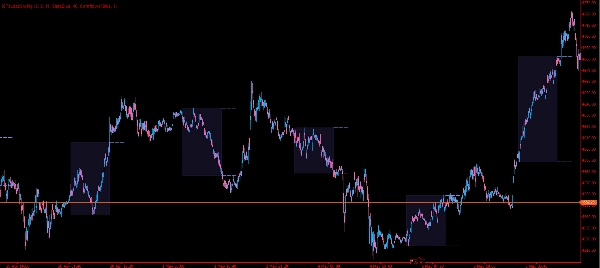
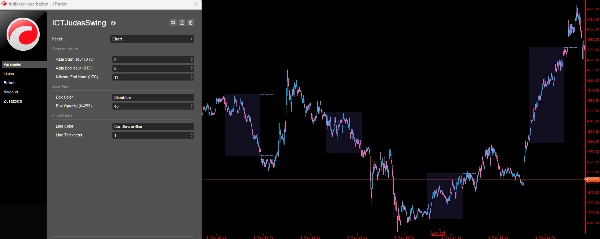
This indicator automatically identifies and visualizes the Asia trading session range on your chart each day. It draws a filled, colored rectangle covering the entire Asia session (default 00:00–08:00 UTC), capturing the session's high and low. Once the session closes, two dashed level lines extend from the session's close time forward into the London killzone (default until 11:00 UTC), keeping the key levels visible precisely when they matter most for ICT-based analysis.

The tool is built around the ICT (Inner Circle Trader) concept of the Judas Swing — the idea that price will often manipulate above or below the Asia range during the early London session before reversing in the true direction. Having the Asia high and low clearly marked makes it straightforward to spot these sweeps as they develop in real time.

How to use it

Identifying the manipulation sweep (Judas Swing): Watch for price to push above the Asia high or below the Asia low during the London killzone (roughly 08:00–11:00 UTC). A wick or short-lived break of one of the level lines — especially if it coincides with a Fair Value Gap or an Order Block on a lower timeframe — is a classic Judas Swing setup. You then look for a reversal entry back inside or away from the range.

Session timing customization: All session boundaries are fully configurable in UTC hours. If you trade the New York session instead, you can repurpose the indicator by setting the "Asia" window to the London session (e.g. 02:00–08:00 UTC) and the killzone end to the New York open (e.g. 13:00 UTC), so the same visual logic applies to NY open manipulation setups.

Multi-timeframe use: The indicator works on any timeframe. On the 15-minute or 1-hour chart it gives a clear macro picture of the daily range structure. Dropping to the 1-minute or 5-minute chart with the indicator still active lets you time precise entries at the level lines once a sweep and reversal structure forms.

Applicable markets: The indicator works on any instrument available in cTrader — forex pairs, indices, commodities, crypto, or anything else that trades through the Asia and London overlap. It is particularly effective on instruments with well-defined session liquidity, such as major forex pairs (e.g. GBP/USD, EUR/USD, USD/JPY) and commodity CFDs like gold (XAU/USD).

Visual customization: Box color, box opacity, line color, and line thickness are all adjustable through the parameter panel, so the indicator blends cleanly into any chart theme — dark or light background alike.

Summary

AI summary
The ICTJudasSwing indicator visualizes the Asia trading session range on your chart by shading the session’s high-to-low range as a colored box (default 00:00–08:00 UTC). After the Asia session closes, it extends dashed lines from the session’s high and low forward into the London killzone (default until 11:00 UTC), highlighting key levels for the Inner Circle Trader (ICT) concept of the Judas Swing. This concept identifies price manipulation—temporary breaks above or below the Asia range during the London session—often followed by reversals.

Users can customize session times in UTC to adapt the indicator for other sessions, such as the New York open. It functions across all timeframes, providing a macro view on higher timeframes and precise entry timing on lower ones. The indicator supports any instrument available on cTrader, including forex pairs, indices, commodities, and cryptocurrencies, especially those with defined session liquidity like GBP/USD or XAU/USD.

Visual elements such as box color, opacity, line color, and thickness are adjustable to fit various chart themes. The indicator aids in identifying key levels, liquidity grabs, fair value gaps, and market structure shifts related to session-based price action.

Indicator profile
Indicator category
Market structure (SMC)
Output type
Visualisation
Data requirements
Bars only
Supported signals
Breakout
Reversal
Level break
Session opening range

Customer reviews

0.0
Reviews: 0
Customer reviews
No reviews for this product yet. Already tried it? Be the first to tell others!

Discussion

FAQ

Fair Value Gap
Key Levels
Market Structure
Liquidity Grab
Products available through cTrader Store, including trading bots, indicators and plugins, are provided by third-party developers and made available for informational and technical access purposes only. cTrader Store is not a broker and does not provide investment advice, personal recommendations or any guarantee of future performance.

More from this author

Indicator
RSI
Forex
+4
High-probability trading signals in the fast-paced world of forex and CFD trading.
Indicator
Prop
Stocks
+4
High-Performance Renko Chart Indicator with Advanced filtering method - built for Renko and candlestick charts.
Indicator
ATR
MSS
+5
Detects ICT Turtle Soup setups — liquidity sweeps with MSS confirmation, ATR filter & kill zone session filter.
Indicator
SMC
Prop
+15
Automatic Elliott Wave Detection with Professional Filters
Indicator
Fibonacci
Key Levels
DailyTargets: Dynamic ADR-based levels & targets. Includes Buy/Sell zones, previous Hi/Lo, and automated trend alerts.
Indicator
EMA
RSI
+2
Advanced TDI indicator with Shark Fin signals, chart arrows, MTF RSI, divergence detection and smart alerts.
Indicator
Key Levels
Order Block
+3
Marks NY session range, detects wick sweeps beyond box edges.. One signal per day. Overlay, no repainting!
Indicator
MACD
Key Levels
+2
Trend indicator with multi-timeframe filters, generating signals only on fully completed bricks & candles. No Repaint.
Indicator
Key Levels
Supertrend
+3
Marks London and New York session opening zones and alerts you instantly on breakouts.
cBot
EMA
SL Manager
+5
Fully automated dual-symbol hedging cBot for cTrader.
20.6%
ROI
8.66
Profit factor
Indicator
BOS
Fair Value Gap
+1
ICT Quarterly Theory indicator — color-coded Q1–Q4 session zones with smart entry signals and real-time alerts.
cBot
RSI
Aggressive
automates entries based on the RSX indicator — a smoothed, low-lag variant of the classic RSI.
1.67
Profit factor

You may also like

Indicator
Customize your Moving Average! Choose any timeframe and price source for precision and flexibility in your analysis.
Indicator
Pin Bar
Inducement
+5
Institutional Nasdaq Session Liquidity Map with Live Point HUD, Sweep Alerts & Interactive Playbook.
Indicator
Displays the previous day's, last week's, and last month's highest and lowest price levels on your chart.
Indicator
ATR
BOS
+5
Clean Smart Money zones with filtered FVGs, confirmed BOS, Order Blocks, and automatic mitigation tracking.
Indicator
EMA
MACD
+5
Multi-timeframe MACD with color-changing line, 4-color histogram & triangle signals.
Indicator
SMC
Prop
+12
Multi-TF FVG + Smart Fibonacci
Indicator
ATR
EMA
+4
Range-filter BUY/SELL signals scored by four confluence layers, with a stop, five targets and a trend panel
Indicator
BB Breakout Oscillator with alerts! Spot trend reversals using Bollinger Bands. Bullish/Bearish crossovers Alerts.
Indicator
AI
ATR
+13
Liquidity Pressure Index is a tool that gives traders deeper insights into the hidden dynamics of market liquidity
Indicator
Forex
BTCUSD
+10
MultiTimeframe MA
Indicator
Fibonacci
Anchor a moving average to any point on the chart and watch it extend dynamically as price evolves.
Indicator
AI
SMC
+9
Identifies market trends (-10 to +10) using HMA with volume confirmation. Includes customizable alerts.
Indicator
Are essentially short intervals during which the algorithm seeks liquidity or adjusts price.....
Indicator
ATR
RSI
+1
Super Trend Rsi ,ATR + trend change distance + dynamic Alpha, divergence/convergence
"MA Sabres" logo
Popular
4.2
(4)
$19
Indicator
Conquer the markets with MA Sabres! This indicator spots trend flips with MAs and cool Sabre shapes & alerts.
Indicator
AI
ATR
+27
COT Flows. Clear Direction. 🧭
Indicator
ADX
ATR
+5
EMA-cross signals scored on six confluence layers, with an ATR stop, three targets and a live panel
Indicator
ATR
SMC
+21
MA Quant Adaptive Price Zone Oscillator identifie dynamiquement les zones de prix optimales pour les entrées et sorties.

Price

Since 21/02/2025
466.3M
Traded volume
180.83K
Pips won
25
Sales
7.42K
Free installs