present
Sign up and get $50 off your first purchase
Trading product for Sync Lines Indicator Key Levels Support & Resistance, image 1
Sync Lines
Indicator
Version 1.0, May 2026
Windows, Mac
Trading product for Sync Lines Indicator Key Levels Support & Resistance, image 2
Trading product for Sync Lines Indicator Key Levels Support & Resistance, image 3
Since 06/04/2026

Description

Professional Multi-Chart Level Synchronization Tool for cTrader

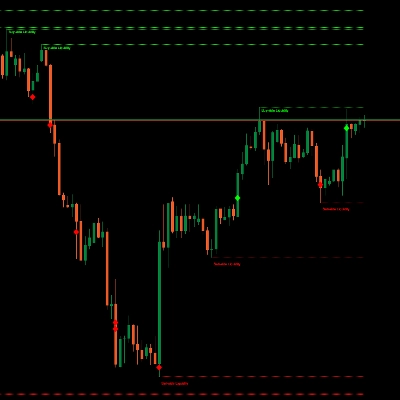
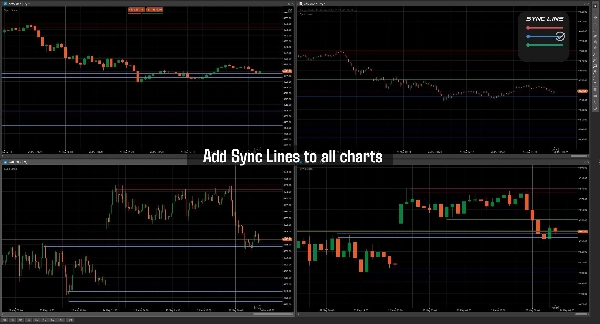
Sync Horizontal Lines is a professional charting utility built for traders who rely heavily on support/resistance zones, liquidity areas, market structure, and multi-timeframe analysis inside cTrader. The indicator allows traders to draw horizontal price levels once and automatically synchronize them across all charts of the same symbol instantly.

Unlike traditional manual chart marking, Sync Horizontal Lines removes repetitive work by keeping levels aligned between different timeframes and chart layouts. Whether you are analyzing M1, M15, H1, or Daily charts, your important levels remain fully synchronized and visually consistent.

The indicator includes a fast hotkey-based workflow for creating, deleting, and color-cycling lines directly from the chart without opening settings panels or menus. Traders can organize support, resistance, liquidity zones, entries, stop losses, take profits, session highs/lows, or custom execution levels using multiple line colors.

A built-in persistent storage system automatically saves all lines locally, ensuring that your levels remain available even after restarting cTrader. Each symbol maintains its own independent synchronized levels, preventing chart clutter between instruments.

Designed for speed and efficiency, Sync Horizontal Lines is lightweight, responsive, and suitable for scalpers, day traders, swing traders, ICT traders, SMC traders, prop firm traders, and multi-monitor trading setups.

Main Features

  • Real-time synchronized horizontal levels across charts
  • Same-symbol multi-timeframe synchronization
  • Automatic local save/load persistence
  • Fast keyboard + mouse workflow
  • Multiple line color management
  • Lightweight and low resource usage
  • Instant level updating across charts
  • No manual re-drawing required
  • Professional workflow optimization


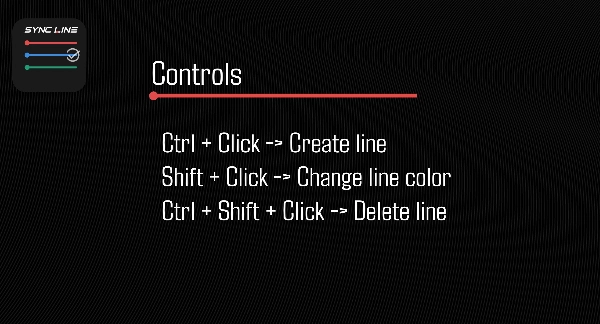
Controls

  • Ctrl + Click β†’ Create line
  • Shift + Click β†’ Change line color
  • Ctrl + Shift + Click β†’ Delete line


Ideal For

  • Support & Resistance traders
  • ICT and SMC strategies
  • Scalping workflows
  • Intraday trading
  • Liquidity mapping
  • Session range marking
  • Multi-monitor setups
  • Professional chart management


Installation

Simply add the indicator to your Multicharts of different timeframe and start drawing using the keyboard shortcuts. No setup required.

The Indicator must be added to different charts to work properly.

Summary

Indicator profile
Indicator category
Support & resistance
Output type
Visualisation
Data requirements
Bars only

Discussion

Customer reviews

0.0
Reviews: 0
Customer reviews
No reviews for this product yet. Already tried it? Be the first to tell others!

FAQ

Key Levels
Support & Resistance
Products available through cTrader Store, including trading bots, indicators and plugins, are provided by third-party developers and made available for informational and technical access purposes only. cTrader Store is not a broker and does not provide investment advice, personal recommendations or any guarantee of future performance.

You may also like

Indicator
SMC
VWAP
+5
Smart ICT Concepts indicator from TV: combining FVGs, Liquidity, Order Blocks, and Market Structure in one tool.
Indicator
Forex
BTCUSD
+5
Buy-Side & Sell-Side Liquidity (BSL/SSL) Indicator
Indicator
SMC
Forex
+5
Silver Bullet by LudwigICT
Indicator
BOS
CHOCH
+5
A professional-grade cTrader indicator for traders following the Inner Circle Trader (ICT) methodology.
Indicator
BOS
CHOCH
+2
The full SMC suite: BOS / CHoCH / MSS, FVG, liquidity, order blocks and a 0-100 confluence score. No repaint.
Indicator
Volume
Order Block
+3
Map market structure, order blocks, liquidity and key zones with an interactive cTrader dashboard.
Indicator
SMC
Prop
+5
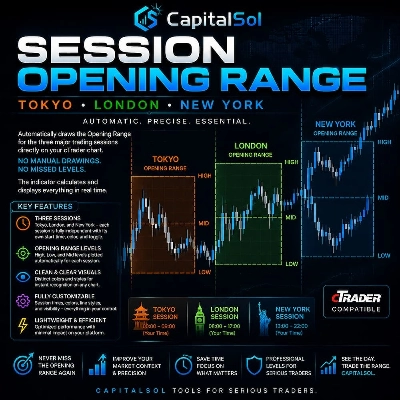
Automatically draws the Opening Range (High & Low) for Tokyo, London, and New York sessions. Configurable start times,
Indicator
AI
ATR
+19
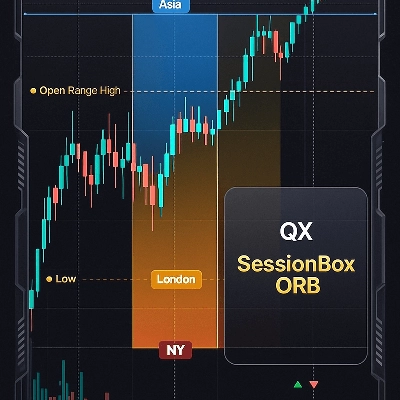
QX SessionBox ORB: Session boxes + ORB levels + clean dashboard with optional closed-candle breakout signals.
Indicator
Forex
Crypto
+5
Experience a new approach with amplitude-based momentum analysis. Smart Trend Detection That Adapts to Market Volatility
Indicator
VWAP
NAS100
+5
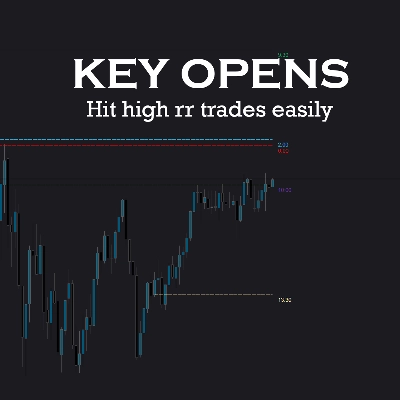
Key NY session opens for NASDAQ (US100) & SP500 to find Tick Precise Entrys for High R:R intraday setups.
Indicator
SMC
VWAP
+5
Most advanced Volume Profile Pivot Box indicator β€” auto pivots, volume zones, smart candle coloring & SMC trading tool.
Indicator
ATR
EMA
+2
Dense EMA rainbow + Pro tools & a tested engine Ҁ” get more from your EMAs, your research base for EMA bots.
Indicator
ATR
Volume
+2
Nine timeframe cards, vivid candles, native BUY/SELL arrows and adjustable ATR-buffer stop-loss reference lines.
Indicator
BOS
EMA
+5
Market structure signals graded A to C, each with a drawn trade plan, plus an adaptive trend ribbon and a trend matrix
Indicator
Doji
Wedge
+5
Angora Pattern Recognition is a cTrader indicator that finds, draws and tracks classic chart patterns automatically.
Indicator
ATR
BOS
+3
Fair Value Gaps with Multi-Timeframe.
Indicator
Prop
Forex
+14
πŸš€See the market’s framework, decide faster. Session-Aware Pivots. Auto Presets. Pro-Grade Zones.πŸš€
Indicator
Risk Dashboard
AI-powered daily range forecasts help traders spot volatility opportunities and plan stops and targets.

Price

Since 06/04/2026