present
Sign up and get $50 off your first purchase
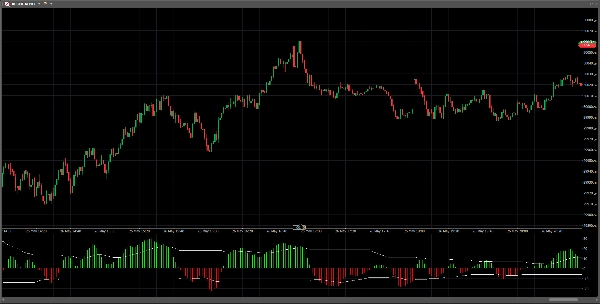
Trading product for Elliot Wave Oscillator PRO Indicator Fibonacci EMA, image 1
Elliot Wave Oscillator PRO
Indicator
Version 1.0, May 2026
Windows, Mac
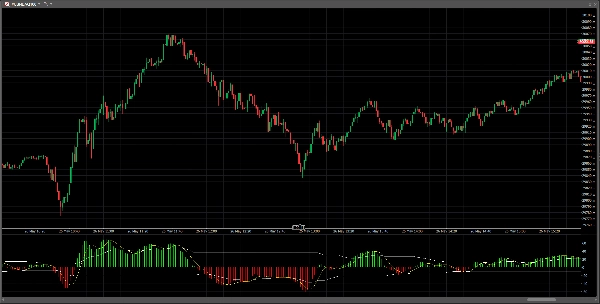
Trading product for Elliot Wave Oscillator PRO Indicator Fibonacci EMA, image 2
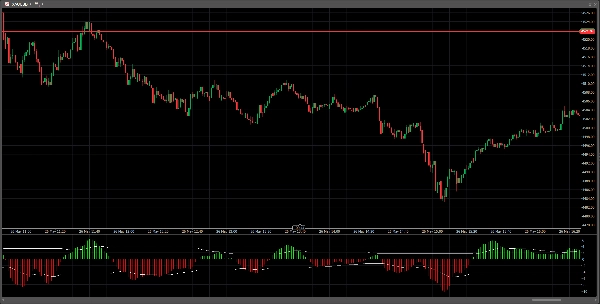
Trading product for Elliot Wave Oscillator PRO Indicator Fibonacci EMA, image 3
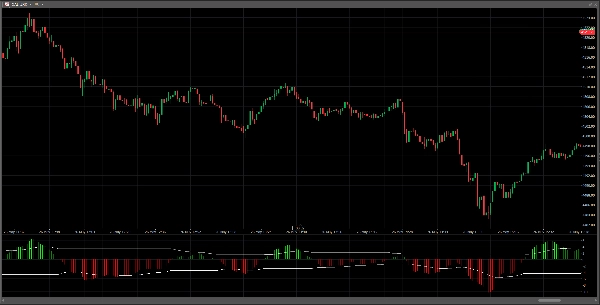
Trading product for Elliot Wave Oscillator PRO Indicator Fibonacci EMA, image 4
Trading product for Elliot Wave Oscillator PRO Indicator Fibonacci EMA, image 5
Trading product for Elliot Wave Oscillator PRO Indicator Fibonacci EMA, image 6
Trading product for Elliot Wave Oscillator PRO Indicator Fibonacci EMA, image 7
Trading product for Elliot Wave Oscillator PRO Indicator Fibonacci EMA, image 8
Trading product for Elliot Wave Oscillator PRO Indicator Fibonacci EMA, image 9
Trading product for Elliot Wave Oscillator PRO Indicator Fibonacci EMA, image 10
Since 05/09/2025
252.09M
Traded volume
5.82K
Pips won
122
Free installs

Description

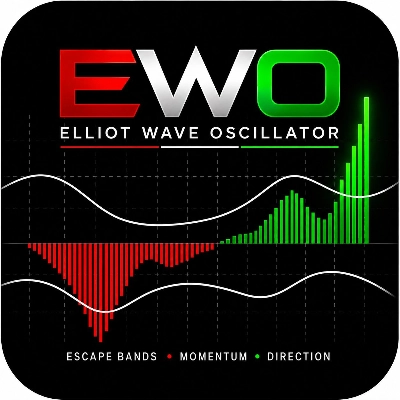
EWO PRO (Elliott Wave Oscillator)


The EWO is a valuable tool for traders looking to gain a comprehensive view of the market and make informed decisions.


1) TRADING SYSTEM:

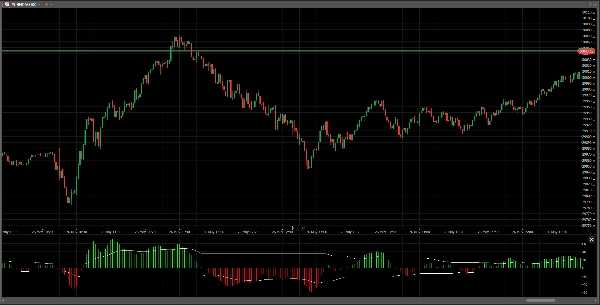
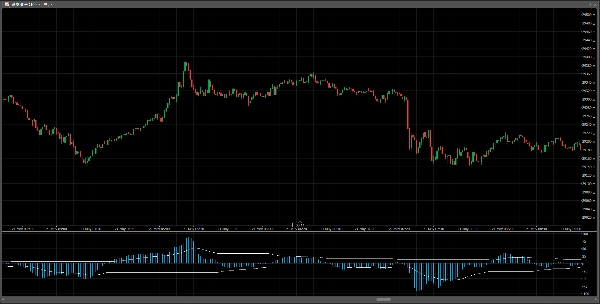
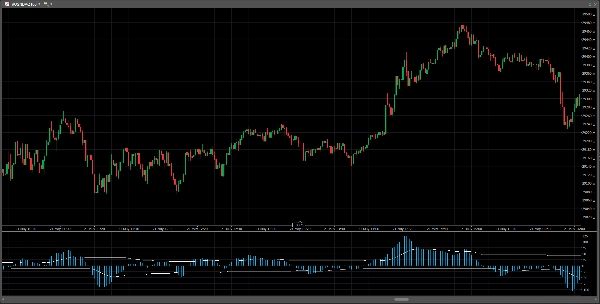
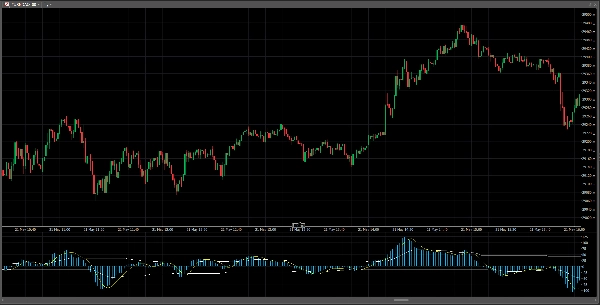
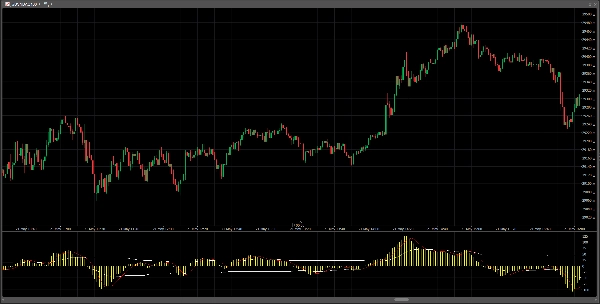
It works as a trading system in itself. It provides a buy signal when the histogram crosses the zero line upwards and a sell signal when the histogram crosses the zero line downwards.


2) INDICATES MOMENTUM:

Momentum refers to the strength and speed with which the price moves. If momentum increases, it means that the price movement has more strength (more buyers or sellers pushing it). If momentum decreases, the movement loses strength, although the price may still continue in the same direction. When the EWO histogram bars break the breakout band, either upwards or downwards, it indicates that momentum is exceptionally strong and that the market is entering a very powerful impulsive phase.


3) WAVE COUNT VALIDATOR:

It allows identifying and validating waves (impulses and corrections) within the counting system proposed by Elliott.


Set the colors to your liking and choice.


EWO (Elliott Wave Oscillator)

El EWO es una herramienta valiosa para los traders que buscan obtener una visión completa del mercado y tomar decisiones informadas.


1) SISTEMA DE TRADING:

Funciona como un sistema de trading en sí mismo. Brinda una señal de compra cuando el histograma cruza la línea cero al alza y una señal de venta cuando el histograma cruza la línea cero a la baja.


2) INDICA EL MOMENTUM:

El momentum se refiere a la fuerza y velocidad con la que se mueve el precio.

Si el momentum aumenta, significa que el movimiento del precio tiene más fuerza (más compradores o vendedores empujándolo).

Si el momentum disminuye, el movimiento pierde fuerza, aunque el precio todavía pueda continuar en la misma dirección.


Cuando las barras del histograma del EWO rompen la banda de escape, ya sea al alza o a la baja, indica que el momentum es excepcionalmente fuerte y que el mercado está entrando en una fase impulsiva muy potente.


3) VALIDADOR DE CONTEO DE ONDAS:

Permite identificar y validar ondas (impulsos y retrocesos) dentro del sistema de conteo propuesto por Elliott.


Configurá los colores a tu gusto y elección.

Summary

AI summary
Elliot Wave Oscillator PRO (EWO PRO) is a technical indicator designed to identify trading trends and opportunities in financial markets. It functions as a standalone trading system by generating buy signals when its histogram crosses above the zero line and sell signals when it crosses below. The indicator measures momentum—the strength and speed of price movements—indicating stronger market impulses when histogram bars break breakout bands. Additionally, EWO PRO serves as a wave count validator, helping traders identify and confirm Elliott Wave impulses and corrections within the Elliott counting framework. Users can customize the histogram colors to their preference. The indicator supports analysis based on momentum and trend strength and operates using bar data inputs. It is categorized under trend indicators and provides signals related to crossovers, divergences, and trend strength.
Indicator profile
Indicator category
Trend
Output type
Filter
Data requirements
Bars only
Supported signals
Cross
Divergence
Trend strength

Discussion

Customer reviews

0.0
Reviews: 0
Customer reviews
No reviews for this product yet. Already tried it? Be the first to tell others!

FAQ

Fibonacci
EMA
MACD
Products available through cTrader Store, including trading bots, indicators and plugins, are provided by third-party developers and made available for informational and technical access purposes only. cTrader Store is not a broker and does not provide investment advice, personal recommendations or any guarantee of future performance.

More from this author

Indicator
ADX
Breaker Block
+1
I share with you the Elliott Wave Oscillator. Hernan Nievas, Rosario, Argentina. April 28, 2026.
Indicator
EMA
Fibonacci
+1
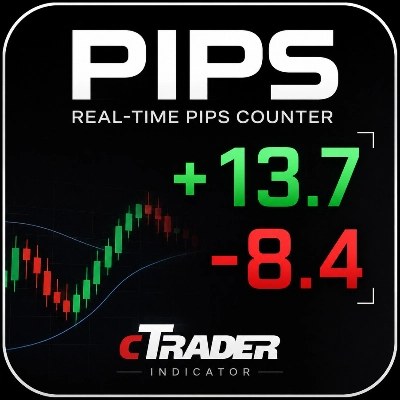
Shows the Pips of your open trade in real time with a clear and customizable display. Rosario, Argentina Julio 28, 2026.
Indicator
Doji
Engulfing
+1
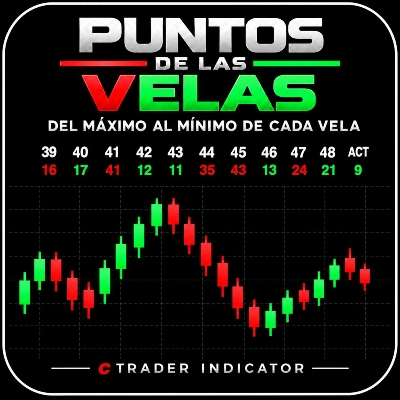
Mide en puntos la distancia entre el Máximo y el Mínimo alcanzados por cada vela, incluida la vela actual.

You may also like

Indicator
RSI
SMC
+17
RSI, MACD, Stochastic, CCI & Momentum divergence scanner with confluence scoring. Never miss a signal again!
Indicator
Prop
Forex
+12
Introducing High Accuracy multi timeframe Swing high and low detector.
Indicator
AI
ATR
+20
Algorithmic trend precision for cTrader.
Indicator
RSI
Breakout
+1
Dynamically adjusts regression channels based on ZigZag extremes, resetting when price breaks bands to track real trends
Indicator
Order Block
Fair Value Gap
+1
This indicator contains most of the ICT strategies that you need. You can turn on/off each one to be shown.
Indicator
ADX
ATR
+5
Configure, simulate, and analyze trading strategies with custom filters, multi-target exits, and detailed performance me
Indicator
Prop
Forex
+4
Automatic Support/Resistance zones from swing points.
Indicator
Supply & Demand
Support & Resistance
RAF Supply Demand Lite v1.0 automatically detects clean Supply and Demand zones using confirmed swing highs and lows. Zo
Indicator
ATR
MSS
+5
Advanced market structure and institutional cycle mapper with visual reference cards and entry alerts
Indicator
Signal
Fractal Arrow Buy and Sell Indicator
Indicator
Forex
BTCUSD
+5
Simple ICT Concepts
Indicator
AI
Prop
+9
A cutting‑edge trading indicator that fuses AI and mathematics with adaptive logic to classify market regimes.
Indicator
Drawdown Monitor
Protect your funded account. Real-time Daily Equity Drawdown monitor with Green / Orange / Red flashing alerts.
Indicator
ATR
SMC
+19
Smart Liquidity Sweep detector with auto-drawing True Channels and real market structure mapping.
Indicator
Volume
Key Levels
View tick activity across a selected chart range with Point of Control, Value Area High and Value Area Low.
Indicator
EMA
SMA
+3
MACD indicator modeled after TradingView, featuring a 4-color momentum histogram, sound/pop-up crossover alerts.
Indicator
Supertrend
Moving Average
Adaptive MA anchored to structural trend changes — no fixed period. Dual Supertrend + swing detection.
Indicator
SMC
Prop
+7
institutional-level market analysis

Price

Since 05/09/2025
252.09M
Traded volume
5.82K
Pips won
122
Free installs