present
Sign up and get $50 off your first purchase
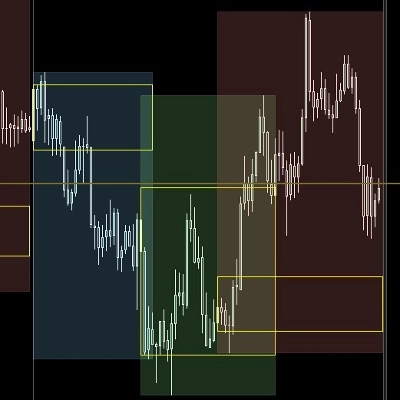
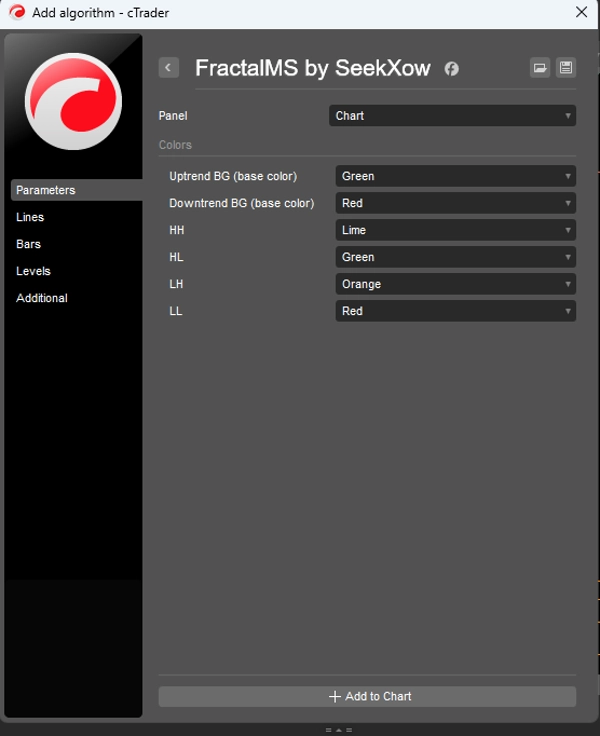
Trading product for FractalMS by SeekXow Indicator Key Levels MSS, image 1
FractalMS by SeekXow
Indicator
Version 1.0, Aug 2026
Windows, Mac
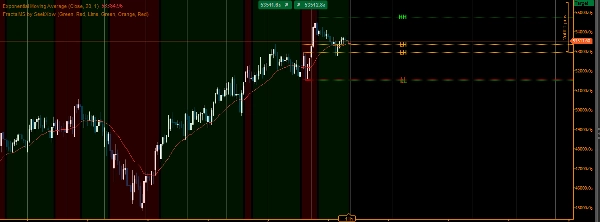
Trading product for FractalMS by SeekXow Indicator Key Levels MSS, image 2
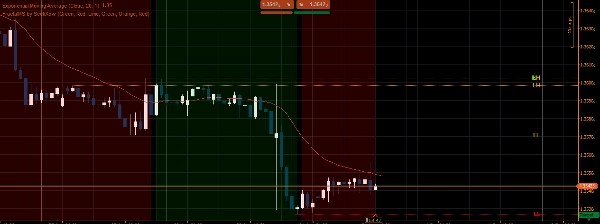
Trading product for FractalMS by SeekXow Indicator Key Levels MSS, image 3
Trading product for FractalMS by SeekXow Indicator Key Levels MSS, image 4
Since 09/12/2025
8.14M
Traded volume
16.34K
Pips won

Description

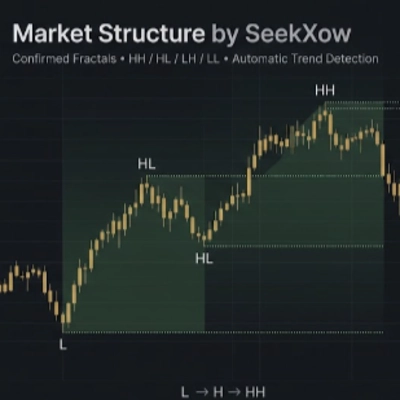
Price-action indicator designed to identify and visualize market structure using confirmed fractal pivots. The indicator tracks swing highs and swing lows and classifies them into:

  • HH — Higher High
  • HL — Higher Low
  • LH — Lower High
  • LL — Lower Low

It uses confirmed fractal pivots to reduce noise and avoid relying on unconfirmed price swings. Consecutive pivots of the same type are compressed so that the relevant extreme is retained before the market structure is evaluated.

Key Features

  • Confirmed fractal-based swing detection
  • Automatic HH / HL / LH / LL classification
  • Bullish and bearish market structure detection
  • Automatic trend-state identification
  • Visual horizontal structure levels
  • Trend background visualization
  • Structure adapts as new confirmed pivots develop
  • Designed for discretionary price-action and market-structure analysis

How It Works

The indicator first detects confirmed swing highs and lows. These pivots are then processed into an alternating sequence of highs and lows. The resulting pivot sequence is used to determine the current market structure and trend. During an uptrend, new highs can establish Higher Highs, while the relevant retracement low becomes the Higher Low. The opposite logic is applied during a downtrend. A break of the relevant structural level can trigger a change in the detected trend.

Intended Use

The indicator can be used as a market-structure layer alongside price action, support/resistance, liquidity analysis, or other technical tools. It is suitable for traders looking for a cleaner visual representation of swing structure across different timeframes.

Note: This indicator is a technical analysis tool and does not provide financial advice or guarantee trading results.

Summary

AI summary
FractalMS by SeekXow is a price-action indicator that identifies and visualizes market structure using confirmed fractal pivots. It detects swing highs and lows and classifies them into four pivot types: Higher High (HH), Higher Low (HL), Lower High (LH), and Lower Low (LL). By relying on confirmed fractal pivots, the indicator reduces noise and avoids repainting, compressing consecutive pivots of the same type to retain relevant extremes before evaluating market structure.

Key features include automatic classification of pivot types, bullish and bearish market structure detection, trend-state identification, visual horizontal structure levels, and trend background visualization. The indicator continuously adapts as new confirmed pivots develop.

FractalMS works by detecting confirmed swing highs and lows, processing them into an alternating sequence to determine current market structure and trend. During uptrends, it identifies higher highs and higher lows; during downtrends, it identifies lower highs and lower lows. Breaking structural levels signals potential trend changes.

Designed for discretionary price-action and market-structure analysis, this tool supports traders seeking a clearer visual representation of swing structure across multiple timeframes. It complements other technical tools such as support/resistance and liquidity analysis.

Indicator profile
Indicator category
Market structure (SMC)
Output type
Visualisation
Data requirements
Bars only
Supported signals
Breakout
Trend strength
Level break
Reversal
Level touch

Discussion

Customer reviews

0.0
Reviews: 0
Customer reviews
No reviews for this product yet. Already tried it? Be the first to tell others!

FAQ

Key Levels
MSS
Market Structure
Support & Resistance
Products available through cTrader Store, including trading bots, indicators and plugins, are provided by third-party developers and made available for informational and technical access purposes only. cTrader Store is not a broker and does not provide investment advice, personal recommendations or any guarantee of future performance.

More from this author

cBot
Key Levels
Conservative
+5
XAUUSD market-structure cBot with dynamic risk, adaptive entries and automated trade management.
3.8
Profit factor

You may also like

Indicator
ATR
EMA
+5
Candle timer with live profit tracking on chart – displays pips, currency value, and percentage in real time.
Indicator
BOS
Fibonacci
+4
Automatically draws major trading sessions, killzones, and SMC daily liquidity targets directly on your cTrader charts.
Indicator
Plot higher-timeframe Bollinger Bands for clearer structure, pullback zones, and breakout signals—without switching char
Indicator
Inside Bar
Save time by lighting a candle to look within yourself in another temporality
Indicator
SMC
Prop
+4
📈 Trading Sessions Indicator — London, New York & Tokyo Visualize Key Market Sessions + High/Low Levels with Precision
Indicator
ATR
RSI
+5
Delta RSI Candle Pro, the indicator that transforms ordinary candlesticks into powerful momentum visualizers.
Indicator
Prop
Forex
+2
⚔️ JPY Samurai Breakout Pro — Professional Breakout Indicator for cTrader ⚔️
Indicator
AI
RSI
+18
Session boxes with UTC offset, OR logic, adjustable opacity, and multi-day lookback.
Indicator
Color-Based Market Pressure & Volatility Visualizer The Kandika Heatmap Indicator
Indicator
ATR
MSS
+5
Advanced market structure and institutional cycle mapper with visual reference cards and entry alerts
Indicator
Forex
BTCUSD
+4
This indicator is designed to perform multiple non-linear regression analysis using four independent variables.
Indicator
Alpha Sentiment Pro - See the Market's Pulse Before It Moves
Indicator
ATR
Wedge
+2
Strong Supertrend Turn Market Movement into a Clear Map Market analysis
Indicator
BOS
EMA
+5
VWAP Bands indicator with 3 standard deviation levels, buy/sell zones, and a draggable ON/OFF button to toggle the entir
Indicator
Prop
Forex
+12
Identify and trade breakouts with Consolidation Zones! Visualize price consolidation areas for trading opportunities.
Indicator
AI
SMC
+4
Weekly Daily Opening Gaps — NWOG & NDOG Indicator Professional-grade opening gap visualization for institutional traders
Indicator
VWAP
Support & Resistance
Trading.FC$_vwap Algo shows VWAP trends, dynamic support/resistance and deviation bands to spot potential trade entries.
Indicator
Signal
USDJPY
See USD demand in one line—Composite OBV fuses six major FX pairs into a clear momentum gauge.

Price

Since 09/12/2025
8.14M
Traded volume
16.34K
Pips won