
平均足ローソク足インジケーター
このインジケーターは、チャート上に直接平均足ローソク足を表示します。
インストール方法:
- インジケーターを希望のチャートにドラッグします。
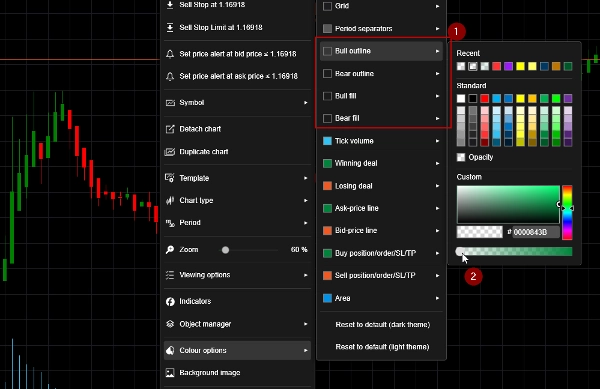
- チャートを右クリックし、「Colour options」を選択します。
- Bull Outline、Bull Fill、Bear Outline、Bear Fillを「Transparent」に設定します。スクリーンショット1を参照してください。
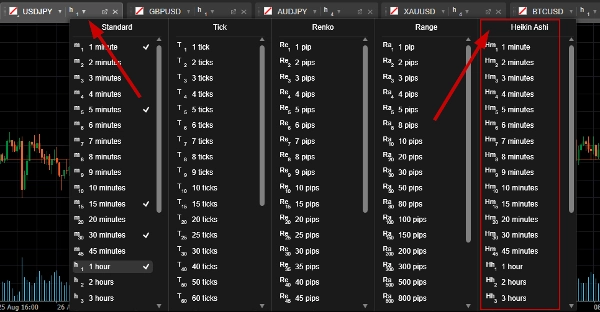
インジケーターなしで平均足ローソク足を表示するには、スクリーンショット2を参照してください。
インジケーターのプロフィール
0.0
レビュー: 0
カスタマーレビュー
この商品にはまだレビューがありません。お使いになったことがある方は、ぜひレビューをお願いします。
Forex
Crypto
Stocks
cTrader Storeで入手可能な取引ボット、インジケーター、プラグインなどの商品は、第三者の開発者が提供するものであり、情報と技術の取得のみを目的としてご利用いただけます。cTrader Storeはブローカーではなく、投資助言や個人的な推奨を行うことも、将来のパフォーマンスを保証することもありません。


これも好きかも


登録日 15/06/2025
639
無料インストール