Descrizione
PANORAMICA
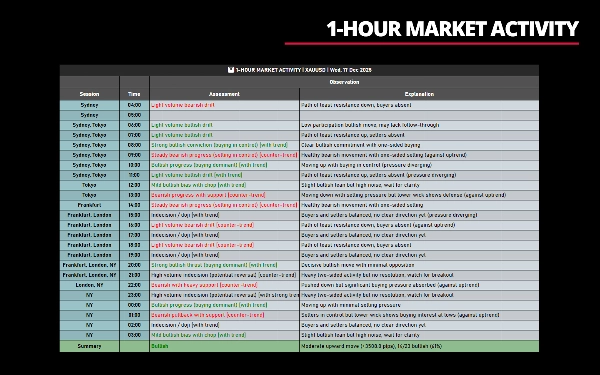
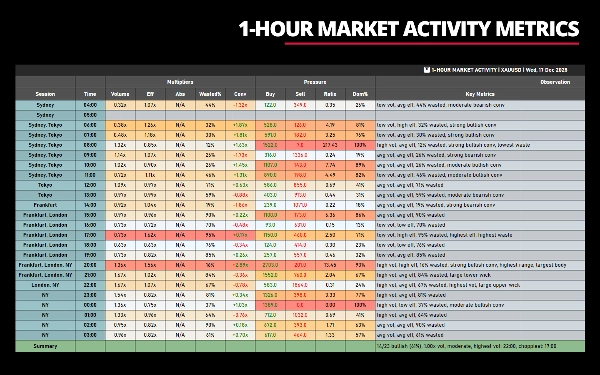
Volume Efficiency Analyzer è uno strumento completo di analisi barra per barra che misura la relazione tra volume (sforzo) e movimento del prezzo (risultato). È stato originariamente creato per uso personale per rispondere a una domanda specifica: "Il mercato si muove in modo efficiente o c'è molta attività senza progressi significativi?"
Questo indicatore NON produce alcun output grafico. Visualizza solo analisi statistiche e metriche in formato tabellare—niente linee, segnali o sovrapposizioni di prezzo. Queste metriche misurano e quantificano la qualità e le caratteristiche dell'azione del prezzo e del comportamento del mercato, aiutandoti a capire se i movimenti sono decisivi, esauriti, contestati o indecisi—dopo che si sono verificati.
__________________________________________________________________________________________
A COLPO D'OCCHIO
Output: Dati statistici (nessun grafico)
Visualizzazione: Formato tabellare
Intervalli temporali: Da sub-giornaliero a mensile
Metriche: Oltre 20 indicatori di efficienza/pressione
Ideale per: Analisi del volume, valutazione della qualità
__________________________________________________________________________________________
CONCETTO FONDAMENTALE: SFORZO VS RISULTATO
La premessa fondamentale è semplice:
- Sforzo = Volume Tick (attività di trading)
- Risultato = Movimento del prezzo (range, corpo, variazione netta)
I mercati efficienti producono movimenti di prezzo sostanziali con volume ragionevole—i movimenti sono puliti e decisivi.
I mercati inefficienti mostrano alto volume ma progresso netto limitato—i movimenti sono irregolari, contestati o assorbiti.
Misurando questa relazione tra singole barre e periodi aggregati, puoi identificare:
- Condizioni di trend vs. laterali
- Impegno vs. indecisione
- Esaurimento vs. continuazione
- Mercati unilaterali vs. bilaterali
__________________________________________________________________________________________
CONFIGURAZIONE DEI PARAMETRI CHIAVE
Questi cinque parametri controllano quali dati l'indicatore visualizza. Comprendere come funzionano è cruciale per un uso efficace.
1. Parametro Data
Scopo: Definisce quale data/periodo analizzare.
Esempi di formato:
""(vuoto) – Giorno di trading più recente con dati"18/12/2025"– Data specifica (GG/MM/AAAA)"12/2025"– Intero mese (MM/AAAA)"2025"– Intero anno (AAAA)
2. Parametro Intervallo Orario
Scopo: Filtra quali ore visualizzare su intervalli sub-giornalieri.
Si applica a: Solo intervalli sub-giornalieri (da 1 minuto a 1 ora)
Esempi di formato:
""(vuoto) – Intera giornata di trading 24 ore"8-16"– Dalle 8:00 alle 16:00"08:00-16:30"– Dalle 8:00 alle 16:30"14"– Dalle 14:00 all'ora corrente
3. Parametro Intervallo Settimane
Scopo: Filtra quali settimane del mese visualizzare.
Si applica a: Solo intervalli multi-ora (da 2 a 12 ore)
Esempi di formato:
""(vuoto) – Tutte le settimane del mese"1"– Solo la prima settimana"1,3"– Settimane 1 e 3"2,3,4"– Settimane 2, 3 e 4
4. Parametro Intervallo Mesi
Scopo: Filtra quali mesi dell'anno visualizzare.
Si applica a: Solo intervalli settimanali
Esempi di formato:
""(vuoto) – Tutti i mesi dell'anno"1"– Solo gennaio"1,6,12"– Gennaio, giugno, dicembre"3,4,5,9,10,11"– Q1 (primavera) e Q4 (autunno)
5. Parametro MaxDataRows
Scopo: Limita quante righe (barre) sono visualizzate nella tabella.
Si applica a: Tutti gli intervalli temporali
Valore predefinito: 24
Formato:
-1o0– Mostra tutti i dati disponibili (nessun limite)- Qualsiasi numero positivo – Mostra al massimo quel numero di righe
__________________________________________________________________________________________
CARATTERISTICHE
Flessibilità
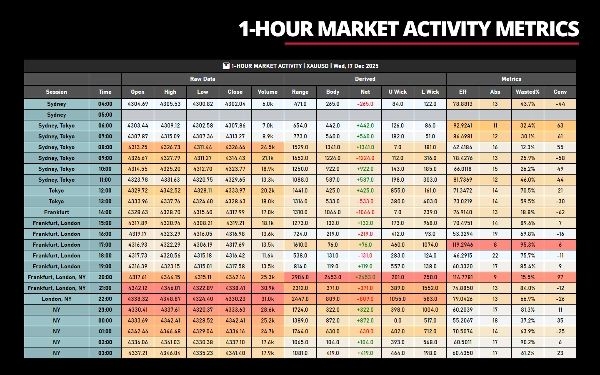
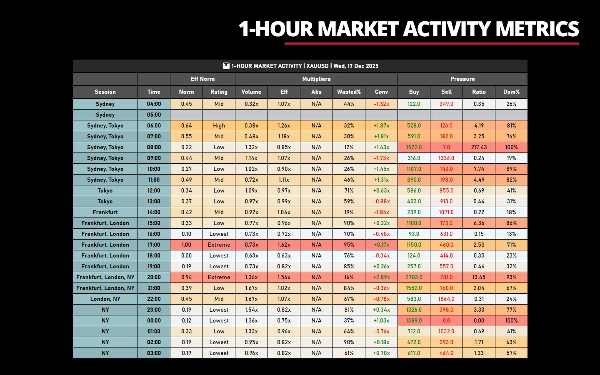
- 8 Gruppi di Colonne: Attiva/disattiva la visibilità di Dati Grezzi, Derivati, Metriche, Eff Norm, Moltiplicatori, Pressione, Osservazioni Chiave, Metriche Chiave
- Molteplici Intervalli Temporali: Funziona su grafici sub-giornalieri (1m-1h), multi-ora (2h-12h), giornalieri, settimanali e mensili
- Filtraggio: Filtro intervallo orario (es. "8:00-16:00"), filtro settimana (es. "1,3"), filtro mese (es. "1,6,12")
- Max Righe: Limita la visualizzazione agli N periodi più recenti o centra attorno alla barra in formazione
- Evidenziazione Colori: Evidenziazione a gradiente opzionale per qualsiasi gruppo di colonne basata sulla metrica selezionata
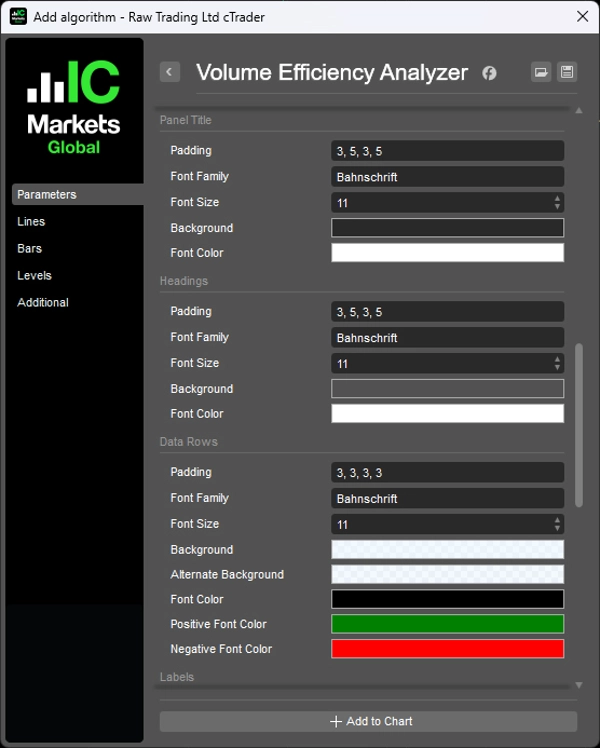
- Stile Personalizzabile: Controllo completo su font, colori, padding, larghezze colonne
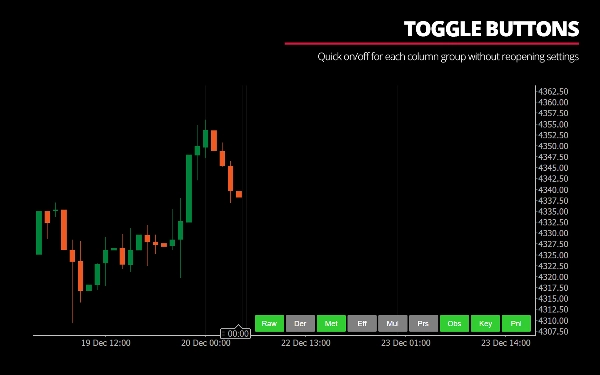
- Pulsanti di Attivazione: Accensione/spegnimento rapido per ogni gruppo di colonne senza riaprire le impostazioni
Supporto Fuso Orario
- Si adatta all'ora del server del broker rispetto all'ora locale
- Ore di inizio sessione configurabili (Sydney, Tokyo, Francoforte, Londra, NY)
- Inizio giornata di trading oraria (es. 4:00 AM per trader sessione asiatica)
Ottimizzazioni delle Prestazioni
- Ricerca binaria per lookup efficienti delle barre
- Calcoli min/max in singola passata per evidenziazione
- Limitazione di 500ms sugli aggiornamenti in tempo reale per evitare ritardi
- Suggerimenti di ricerca per evitare lookup ridondanti
__________________________________________________________________________________________
COMPRENDERE LE METRICHE
Cosa rende un Buon Movimento?
- Alta Efficienza: Si è spostato molto con poco volume
- Basso Wasted%: Minimi stoppini, corpi direzionali puliti
- Pressione Allineata: Pressione di acquisto dominante nelle chiusure rialziste (o viceversa)
- Forte Convinzione: Alto impegno direzionale
Cosa rende un Pessimo Movimento?
- Bassa Efficienza: Ha richiesto molto volume per muoversi poco
- Alto Wasted%: Stoppini grandi, corpi piccoli (movimento irregolare)
- Pressione Contraddittoria: Chiusura rialzista ma pressione di vendita dominante
- Debole Convinzione: Nessun impegno direzionale nonostante il volume
Cosa significa Assorbimento?
Quando il prezzo fatica a muoversi nonostante l'alto volume, il mercato sta "assorbendo" quel volume. Questo indica:
- Alto Assorbimento: Presenza di resistenza/supporto, difficile muovere il prezzo
- Basso Assorbimento: Movimento facile, poca opposizione
Esempi di interpretazioni:
"Forte spinta rialzista (acquisti dominanti)"
- Alto volume + Alta efficienza + Basso spreco + Netto rialzista + Pressione acquisti dominante
"Indecisione ad alto volume (potenziale inversione)"
- Alto volume + Spreco estremo + Corpo minuscolo + Pressione bilanciata
"Chiusura rialzista nonostante pressione ribassista"
- Chiuso in rialzo ma pressione vendita superiore a quella acquisto (divergenza, potenziale trappola)
"Bassa partecipazione, nessun impegno"
- Basso volume + Efficienza media + Nessuna dominanza di pressione chiara
__________________________________________________________________________________________
VANTAGGI E BENEFICI
1. Quantifica l'Intuizione
- Se hai mai pensato "questo sembra irregolare" o "questo movimento sembra debole", questo indicatore quantifica quelle osservazioni
- Fornisce metriche oggettive per valutazioni soggettive
2. Analisi Multi-Dimensionale
- La maggior parte degli strumenti mostra volume O pattern di prezzo. Questo mostra la loro relazione
- Combina volume, struttura del prezzo, bias direzionale e dinamiche di pressione in una vista
3. Consapevole del Contesto
- Le valutazioni delle singole barre considerano il contesto del trend
- Distingue tra "consolidamento in trend rialzista" e "consolidamento in trend ribassista"
- Segnala movimenti contro trend che potrebbero essere trappole
4. Educativo
- Interpretazioni in linguaggio naturale aiutano a comprendere le dinamiche di mercato
- Col tempo, inizierai a riconoscere i pattern di efficienza senza l'indicatore
5. Applicazione Versatile
- Trader di trend: Identifica quando i trend sono forti o in esaurimento
- Trader di range: Individua zone di consolidamento ad alto spreco
- Trader di breakout: Rileva rotture decisive ad alto volume vs. falsi breakout
- Trader di volume: Vedi il volume nel contesto di ciò che ha realizzato
6. Nessun Ritardo
- Tutti i calcoli si basano su barre completate (o barra in formazione corrente)
- Nessuna levigatura, nessuna media mobile, nessuna ridipintura
__________________________________________________________________________________________
SFIDE E PREOCCUPAZIONI
Prima di usare questo indicatore, considera questi importanti aspetti:
Questo indicatore NON è per tutti:
1. Alta Complessità
- Oltre 20 metriche distribuite su 8 gruppi di colonne
- Richiede comprensione di analisi del volume, azione del prezzo e microstruttura di mercato
- Curva di apprendimento ripida—aspettati 1-2 settimane di osservazione prima che i pattern diventino chiari
2. Sovraccarico di Informazioni
- La vista predefinita "mostra tutto" è opprimente
- Devi personalizzarla per adattarla al tuo focus di trading
- È possibile paralisi decisionale se provi a usare tutte le metriche contemporaneamente
3. Non è un Sistema di Trading
- Questo indicatore NON ti dice quando comprare o vendere
- Ti dice cosa sta facendo il mercato, non cosa DEVI fare
- Devi integrarlo con le tue regole di ingresso/uscita
4. Richiede Interpretazione
- "Indecisione ad alto volume" potrebbe significare pre-breakout O esaurimento
- "Movimento rialzista efficiente" non garantisce continuazione
- Hai bisogno del contesto di mercato oltre a ciò che mostra l'indicatore
5. Limitazioni del Volume
- Il Forex usa volume tick (conteggio transazioni), non volume reale
- Strumenti a bassa liquidità possono mostrare letture di efficienza erratiche
- Eventi di notizie possono creare picchi di volume che distorcono temporaneamente le metriche
6. Prestazioni su Intervalli Inferiori
- Su grafici a 1 minuto con oltre 100 barre visibili, l'interfaccia può risultare lenta
- Più barre = più calcoli per aggiornamento
- Consigliato: usa grafici ≥5 minuti per monitoraggio in tempo reale
7. Nessun Avviso
- Attualmente non genera avvisi per condizioni specifiche
- Devi monitorare manualmente la visualizzazione
8. Soglie Soggettive
- "Alto" volume è definito come 1.25x della media—questa è la mia soglia personale
- "Spreco estremo" è ≥80%—anche soggettivo
- Potresti non essere d'accordo con queste definizioni, ma sono codificate
__________________________________________________________________________________________
COME FUNZIONA
1. Raccolta Dati
- Definisci il periodo di analisi (intervallo data/ora)
- Per ogni barra nel periodo, raccogli dati OHLCV dalle barre del grafico
- Calcola metriche derivate ed efficienza per ogni barra
- Aggrega le metriche per stabilire medie ed estremi
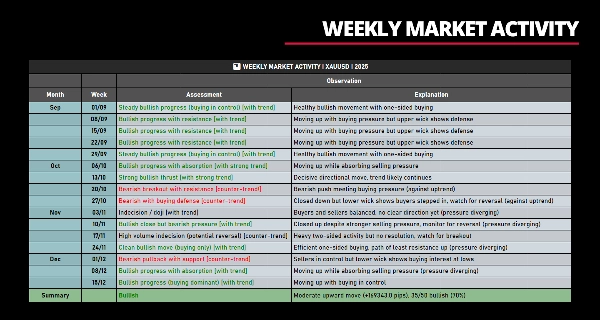
2. Logica di Interpretazione
Le valutazioni in linguaggio naturale seguono una matrice decisionale basata su priorità:
Priorità 1: Pattern di Indecisione
- Percentuale di spreco estrema (≥80%) o corpo minuscolo con stoppini alti → Segnali Doji/Rifiuto
- Alto volume + spreco estremo → Potenziale esaurimento
Priorità 2: Scenari ad Alto Volume
- Alto volume + alta efficienza + basso spreco → Spinta decisiva
- Alto volume + alta efficienza + alto spreco → Breakout con resistenza
- Alto volume + bassa efficienza + alto spreco → Movimento assorbito/contestato
Priorità 3: Segnali Guidati dall'Efficienza
- Alta efficienza indipendentemente dal volume → Movimenti puliti/efficienti
- Bassa efficienza → Deriva, grind o movimenti deboli
Priorità 4: Ripiego per Livello di Volume
- Basso volume → Deriva, nessun impegno
- Volume medio → Valutato da convinzione, % corpo, livello di spreco
3. Raffinamenti:
- L'analisi della pressione rileva contraddizioni (es. "chiusura rialzista ma pressione vendita dominante")
- L'analisi degli stoppini identifica rifiuti (stoppini superiori su barre rialziste = venditori hanno difeso i massimi)
- Il contesto del trend aggiunge marcatori "[con trend]" o "[contro trend]"
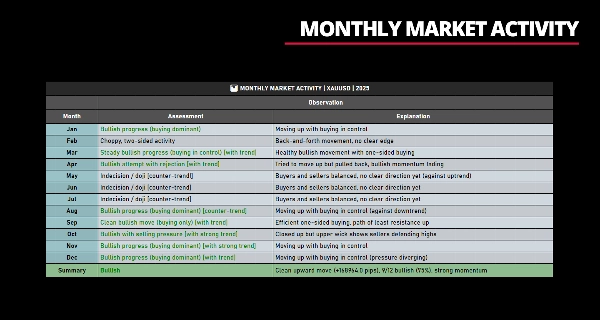
4. Calcolo Riassuntivo
- Conta barre rialziste vs. ribassiste
- Calcola efficienza direzionale (movimenti rialzisti vs. ribassisti)
- Misura rapporti di assorbimento (quanta resistenza ha affrontato ogni lato)
- Calcola movimento netto cumulativo e contesto del trend
- Genera bias unificato che combina conteggio, magnitudine e direzione del trend
__________________________________________________________________________________________
NOTE TECNICHE
Metodo di Calcolo
- Usa analisi cumulativa delle barre all'interno di ogni periodo
- Somma volume, stoppini, corpi di tutte le sotto-barre
- Calcola bias direzionale netto dai dati cumulativi
- Più accurato della semplice analisi OHLC
Normalizzazione
- Efficienza normalizzata rispetto a min/max nel dataset visibile
- Garantisce che le valutazioni siano contestualmente appropriate
- Scala di valutazione: Estremo (80-100%) → Alto (60-80%) → Medio (40-60%) → Basso (20-40%) → Minimo (0-20%)
Contesto del Trend
- Calcola pips netti cumulativi su tutti i periodi precedenti
- Identifica periodi direzionali consecutivi
- Confronta efficienza e pressione recenti vs. precedenti
- Etichette: "Trend rialzista (forte)", "Trend ribassista (debole)", "Laterale"
__________________________________________________________________________________________
NOTA FINALE
Questo indicatore è stato creato con la convinzione che comprendere la qualità del mercato sia più prezioso che prevedere la direzione.
Invece di chiedere "il prezzo salirà?", chiede:
- "Questo movimento è di alta qualità?"
- "Acquirenti/venditori stanno lottando o sono efficienti?"
- "Questo breakout è sostenibile o debole?"
- "Le dinamiche attuali sono allineate o divergenti?"
Concentrandosi su qualità piuttosto che previsione, i trader possono:
- Evitare setup a bassa probabilità
- Entrare in movimenti con impegno alle spalle
- Uscire quando lo sforzo supera il risultato
- Capire quando stare fuori (ambiente di scarsa qualità)
Se apprezzi trasparenza, educazione e comprensione del perché i prezzi si muovono come fanno, questo indicatore può essere prezioso per te.
Se preferisci semplicità e segnali rapidi, altri strumenti ti serviranno meglio.
__________________________________________________________________________________________
ALTRI INDICATORI GRATUITI
Esplora un'ampia gamma di strumenti di analisi di mercato—dalla struttura e volume alla regressione, volatilità e intervalli temporali personalizzati.
Il codice sorgente è disponibile nel repository GitHub.
Tutti gratuiti da usare. Ma se vuoi offrire un supporto per un caffè, puoi farlo qui.
Supporto/Resistenza
Volume
- Volume Activity Profiler
- Volume Efficiency Analyzer
- Volume Profile Analytics
- Volume Profile - Aggiornato
- Volume Spread Analysis
- VWAP (Prezzo Medio Ponderato per Volume)
Medie Mobili
- SSL Channel
- Media Mobile Ancorata
- Media Mobile Scalata per Deviazione
- Gann High Low Activator
- Linea di Tendenza Istantanea
- Media Mobile Adattiva di Kaufman con Trend Vision
- Canale Media Mobile
- Suite Medie Mobili
- Media Mobile Canale Trend
Utilità/Personalizzati
Basati su Regressione
Volatilità
Oscillatori
__________________________________________________________________________________________
DICHIARAZIONE DI NON RESPONSABILITÀ
Il trading comporta rischi. Questo indicatore è destinato solo all'analisi tecnica — applica sempre una corretta gestione del rischio e opera responsabilmente.
FEEDBACK E MIGLIORAMENTI
Se hai suggerimenti, richieste di funzionalità o idee per miglioramenti, lascia un commento nella scheda Discussione. Il tuo feedback aiuta a migliorare l'indicatore per tutti.
Riepilogo
Key features include customizable column groups, color highlighting, and time zone adjustments for various trading sessions. The indicator quantifies market conditions by identifying efficient versus inefficient moves, absorption levels, and directional pressure, helping traders distinguish between decisive, exhausted, or indecisive price actions after they occur. It incorporates trend context and natural language interpretations to aid understanding of market dynamics.
Volume Efficiency Analyzer does not generate buy/sell signals or alerts; it is intended to complement traders’ own strategies by providing objective metrics that quantify market quality rather than predict direction. It requires familiarity with volume analysis and market microstructure due to its complexity and information density. The indicator is suitable for trend, range, breakout, and volume-focused traders seeking a comprehensive, multi-dimensional view of market behavior.
Recensioni dei clienti
5 | 100 % | |
4 | 0 % | |
3 | 0 % | |
2 | 0 % | |
1 | 0 % |