
present
Зарегистрируйтесь и получите скидку $50 на первую покупку
Trading product for STOCH-RSI-MFI_noSourceCode Индикатор RSI MFI, image 1
STOCH-RSI-MFI_noSourceCode
Индикатор
Версия 1.1, Sep 2026
Windows, Mac
Trading product for STOCH-RSI-MFI_noSourceCode Индикатор RSI MFI, image 2
Trading product for STOCH-RSI-MFI_noSourceCode Индикатор RSI MFI, image 3
663.91K
Торгуемый объем
1.13K
Выигранные пипы

Описание

Multi-Timeframe Oscillator Dashboard

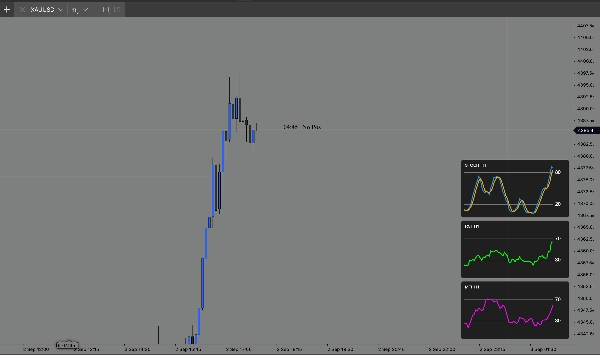
A compact and highly customizable oscillator dashboard designed to keep essential momentum information directly on your main price chart.

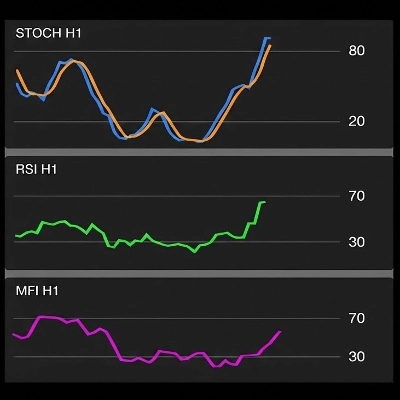
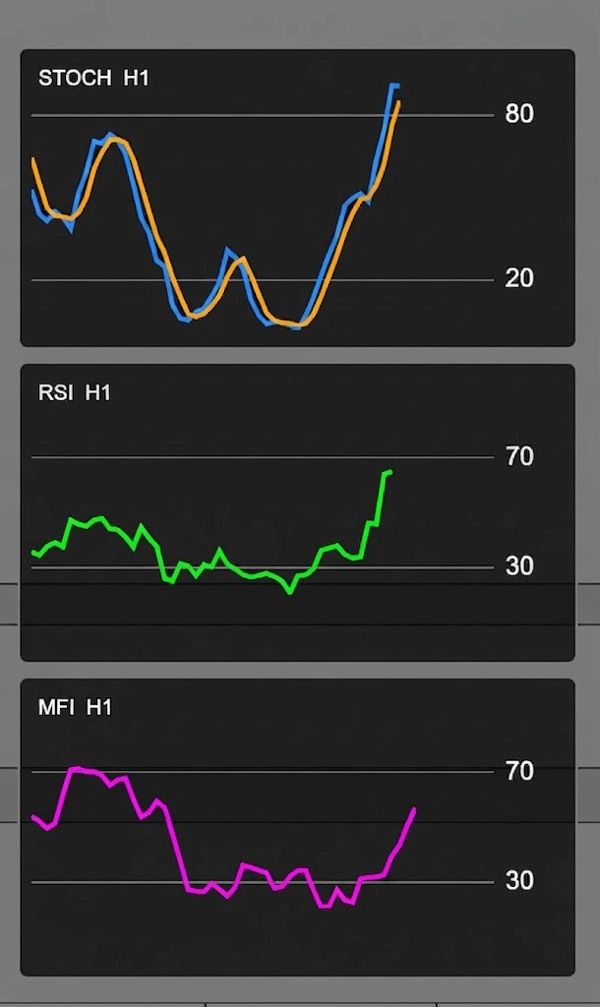
The indicator supports Stochastic, RSI and Money Flow Index (MFI) in separate floating panels. Each oscillator can be enabled or disabled independently, allowing you to display only the information relevant to your trading setup.

Independent Timeframes

Each oscillator can use either the current chart timeframe or its own independently selected timeframe. For example, you can monitor STOCH on H1, RSI on M15 and MFI on H4 while trading from a completely different chart timeframe.

The active timeframe is displayed directly next to each oscillator name, such as STOCH H1, RSI M15 or MFI H4, making multi-timeframe analysis easy to read at a glance.

Customizable Levels

Each oscillator has independent upper and lower reference levels. Default levels are 80/20 for Stochastic and 70/30 for RSI and MFI, while all levels can be adjusted from the indicator settings.

Interactive History

Oscillator panels can be dragged horizontally to inspect previous values without moving the main price chart. Future blank space can also be added to provide additional visual room on the right side of the oscillator.

Flexible Layout & Appearance

Display one, two or all three oscillators simultaneously. Active panels are automatically stacked into a clean compact layout and can be positioned on either side of the chart at the top, center or bottom.

Panel dimensions, spacing, background, opacity, borders, line colors, line thicknesses, level styling, labels and other visual elements can be customized.

Key Features

• Stochastic, RSI and Money Flow Index (MFI)
• Independent ON/OFF control for each oscillator
• Independent timeframe selection for STOCH, RSI and MFI
• Option to automatically use the current chart timeframe
• Active timeframe shown directly in each panel
• Independent upper/lower levels for every oscillator
• Default STOCH levels: 80/20
• Default RSI and MFI levels: 70/30
• Stochastic %K and %D lines
• Horizontal drag for historical inspection
• Configurable future chart space
• Customizable colors and line thicknesses
• Adjustable panel width, height and spacing
• Custom background color and opacity
• Custom border color, thickness and corner radius
• Six chart positioning options
• Compact floating overlay design

This indicator is designed as a visual analysis tool and does not generate trade signals or execute trades automatically.

Сводка

Профиль индикатора

Отзывы покупателей

0.0
Отзывы: 0
Отзывы покупателей
У этого продукта еще нет отзывов. Уже попробовали его? Поделитесь впечатлениями!

Обсуждение

Частые вопросы

RSI
MFI
Stochastic
Продукты, доступные в cTrader Store, включая торговых ботов, индикаторы и плагины, предоставляются сторонними разработчиками и доступны исключительно в информационных и технических целях. cTrader Store не является брокером и не предоставляет инвестиционные консультации, персональные рекомендации или какие-либо гарантии будущей доходности.

Больше от этого автора

Десктопный плагин
Trade Journal
Performance Report
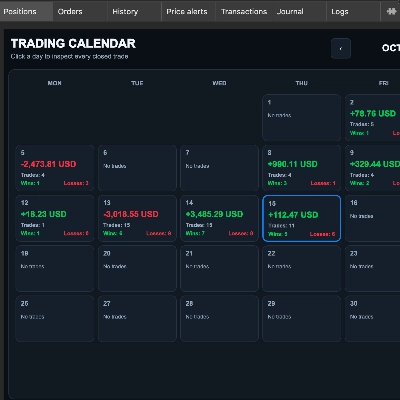
Trading Calendar for Closed CFD Trades: Daily, Weekly, and Monthly Statistics

Вам также может понравиться

Индикатор
AI
SMC
+5
Coloring trendline/ Colored Trendline / Color Trendline
Индикатор
ATR
RSI
+4
RSI bands drawn on price, confluence-scored BUY/SELL signals, an ATR stop with three targets
Индикатор
SMC
Prop
+17
Unlock the true intent of market participants with the Classic Proportional Cumulative Volume Delta CVD!
Индикатор
ATR
RSI
+1
Super Trend Rsi ,ATR + trend change distance + dynamic Alpha, divergence/convergence
Логотип продукта "ATR Bands"
Хит
4.7
(4)
$19
Индикатор
ATR
Prop
+13
Enhance trading with ATR Bands! Visualize market volatility using dynamic upper and lower ATR bands for precise decision
Индикатор
Volume
Select a price range and read POC, VAH and VAL from tick activity on your cTrader chart.
Индикатор
Forex
Crypto
+5
Automatically plots Fibonacci retracement levels using the highest and lowest points of a customizable time range
Индикатор
RSI
Forex
+6
🚀 QQEX Trinity Indicator - The Ultimate Trading Filter 🚀
Индикатор
EMA
VWAP
+2
ORB Range Indicator maps the opening range and gives a practical session-breakout workflow with clear labels.
Индикатор
MACD
Prop
+14
Enhance MACD Histogram! Visualize bull and bear price changes with vibrant colors for clearer, more insightful trading.
Индикатор
ATR
Prop
+15
Initial Range – Where the open writes the script.
Индикатор
ADX
ATR
+2
GOLD SENTINEL v1.0 - A CANDLE-COLORING INDICATOR FOR GOLD.
Индикатор
Forex
BTCUSD
+5
Auto-plots Open, High, and Low of Day/Week/Month/Year. Session candle counter + Round Numbers. Fully customizable
Индикатор
Pin Bar
Inducement
+5
Institutional Nasdaq Session Liquidity Map with Live Point HUD, Sweep Alerts & Interactive Playbook.
Индикатор
Volume
Order Block
+4
Advanced Pro Volume Profile: Double Back-to-Back, Institutional Dynamic, Fixed Range & Order Flow
Индикатор
ATR
BOS
+3
Fair Value Gaps with Multi-Timeframe.
Индикатор
Channel
Key Levels
+1
Monitor a selected chart trendline and confirm breaks on candle close.
Индикатор
Forex
BTCUSD
+11
📈 Adaptive ALMA-Gaussian hybrid trend filter with precision smoothing and clear buy/sell signals.

Цена

663.91K
Торгуемый объем
1.13K
Выигранные пипы
















