คำอธิบาย
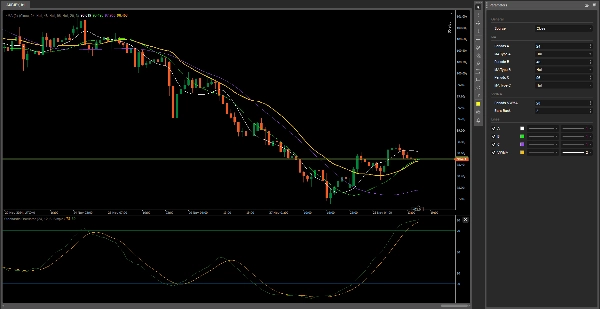
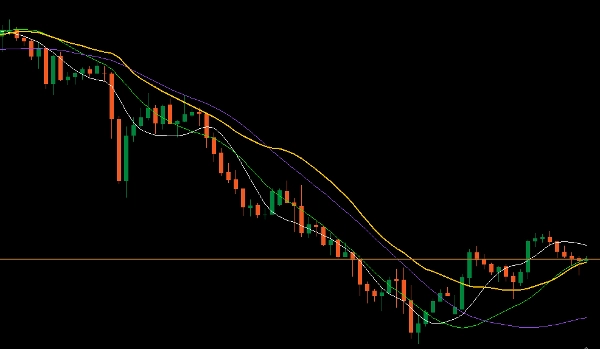
ตัวบ่งชี้นี้ประกอบด้วยค่าเฉลี่ยเคลื่อนที่ 3 ตัวที่สามารถปรับแต่งได้ตามที่คุณต้องการ ตั้งแต่ประเภทของค่าเฉลี่ยเคลื่อนที่ไปจนถึงสี ความหนา และประเภทของเส้น
ตัวที่สี่คือ VWMA (ค่าเฉลี่ยเคลื่อนที่ถ่วงน้ำหนักด้วยปริมาณ) – สูตรทั่วไปสำหรับตัวบ่งชี้นี้คือ - VWMA 3 วัน = (C1 * V1 + C2 * V2 + C3 * V3) / (V1 + V2 + V3)
ในตัวเลือกนี้ ฉันได้สร้างความเป็นไปได้ในการทำซ้ำช่วงเวลาไม่ใช่แค่ 3 ครั้ง แต่สูงสุดถึง 500 ครั้ง
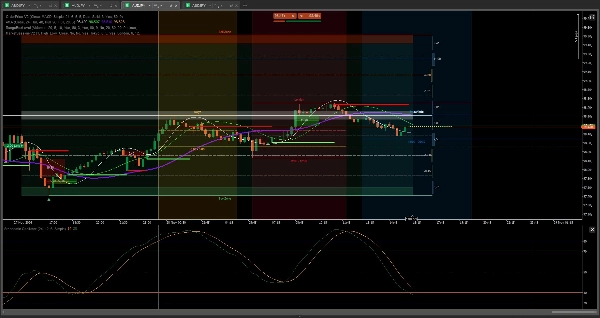
ฉันสร้างสิ่งนี้ขึ้นมาเพื่อให้กราฟสะอาด
พารามิเตอร์เริ่มต้นคือค่าเฉลี่ยเคลื่อนที่ hull ซึ่งสมบูรณ์แบบ และช่วงเวลา 24, 48, 96 เป็นช่วงเวลาที่เหมาะสมที่สุดสำหรับฉันในแต่ละกรอบเวลา
เพิ่มเติม
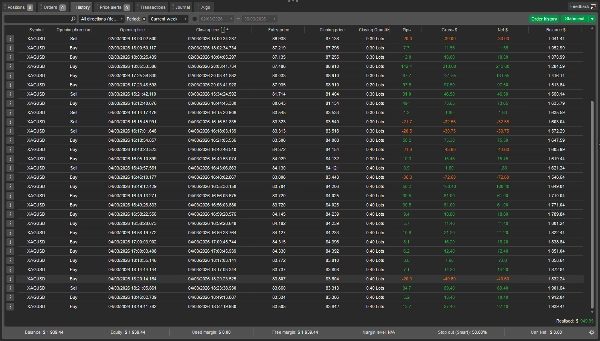
นี่คือเครื่องมือที่ช่วยให้ฉันทำเงิน
https://ctrader.com/products/3441?u=Thomas-Sparrow
https://ctrader.com/products/526?u=Thomas-Sparrow
https://ctrader.com/products/3137?u=Thomas-Sparrow
https://ctrader.com/products/2913?u=Thomas-Sparrow
คุณจะเป็นอมตะ
โชคดี 😀
สรุป
รีวิวจากลูกค้า
5 | 100 % | |
4 | 0 % | |
3 | 0 % | |
2 | 0 % | |
1 | 0 % |