Delta Hacim Göstergesi - cTrader için Gelişmiş Emir Akışı Analizi
Delta Hacim Göstergesi, fiyat hareketinin tek başına gösteremediği alım ve satım baskısını ortaya çıkarmak için tik tik emir akışını analiz eder. Her bar için yukarı tıklamalar (alışlar) ile aşağı tıklamalar (satışlar) arasındaki farkı hesaplayarak gerçek piyasa katılımına dair içgörüler sağlar.
Sürüm 1.0
Şu anda Daha Düşük Zaman Dilimleri için Kararlı Sürüm (1d - 15d)
Yakında Güncellemeler!
Onu Benzersiz Kılan
Gerçek Tik Seviyesi Analizi: Hacim yaklaşık değeri değil - gerçek tik sınıflandırması
Çift Uçurum Sistemleri: Hem bar seviyesi hem de fraktal tabanlı uçurum tespiti
Kalite Doğrulaması: Corwin-Schultz spread tahmini güvenilir sinyaller sağlar
Esnek Görselleştirme: Çoklu renklendirme yöntemleri ve filtreleme seçenekleri
Tam Özelleştirme: Her renk, eşik ve görüntüleme seçeneği yapılandırılabilir
Araştırmaya Dayalı: Hakemli piyasa mikro yapısı araştırmalarına dayanır
------------------------------------------------------------------------------------------------------------------------------------------------------------
Temel Özellikler
------------------------------------------------------------------------------------------------------------------------------------------------------------
Delta Hacim Hesaplama
- Tik Kuralı Sınıflandırması: Her tik alış (+1), satış (-1) veya nötr (0) olarak sınıflandırılır
- Bar Delta: Bar başına net alım/satım baskısı = Alım Hacmi - Satım Hacmi
- Kümülatif Delta: Sürekli yönlü baskıyı gösteren toplam
- Çoklu Fiyat Türleri: Teklif, Talep veya Orta fiyatlar kullanılarak hesaplama
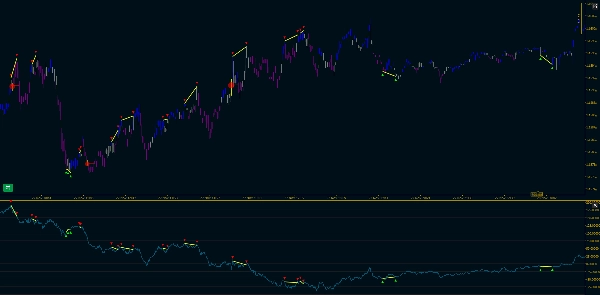
Delta Uçurum Tespiti
Fiyat ve emir akışının uyuşmadığı durumları belirler - potansiyel dönüş sinyali.
İki Filtre Yöntemi:
- Büyüklük + Dengesizlik: Delta gücü ve hacim dengesizliği için doğrudan eşikler
- Yüzdelik Bazlı: Tarihsel dağılıma dayalı uyarlanabilir filtreleme
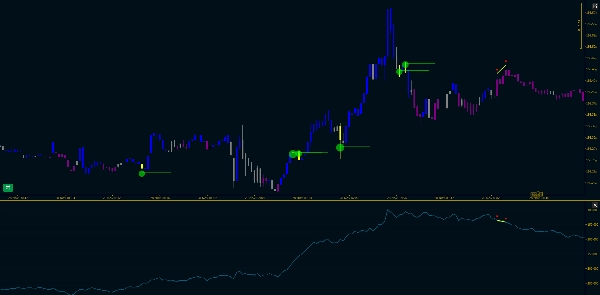
Görsel İşaretler:
- Kontrol Noktasında (en yüksek hacimli fiyat seviyesi) otomatik yerleştirilir
- Boyut delta büyüklüğü ile ölçeklenir
- İsteğe bağlı ileriye uzanan trend çizgileri
Grafik Mum Renklendirme
Üç öncelik seviyesi ile emir akışına göre mumları renklendirir:
- Uçurum (Sarı) - en yüksek öncelik
- CVD Rejimi (isteğe bağlı) - stabil rejim tanımlaması
- Bar Delta (Lime/Kırmızı/Gri) - bar bazında renklendirme
------------------------------------------------------------------------------------------------------------------------------------------------------------
CVD Rejim Analizi
------------------------------------------------------------------------------------------------------------------------------------------------------------
Stabil Renklendirme için İki Yöntem:
1. Aralıkta Konum
- CVD'nin son aralıktaki konumunu gösterir (0-100%)
- Üst %30 = Boğa | Alt %30 = Ayı | Orta %40 = Nötr
- Hızlı, sezgisel, kendini uyarlayan
2. Corwin-Schultz Kalite Filtresi
- Fiyat üzerinde gerçek Corwin-Schultz spread tahmini kullanır
- Piyasa likiditesi yüksek olduğunda (spread dar) CVD'ye güvenir
- Güvenilir olmayan dönemleri otomatik filtreler
- Hakemli araştırmaya dayanır (Corwin & Schultz 2012)
Ana İlke: CVD sadece likit piyasalarda anlamlıdır. Bu yöntem, CVD sinyallerini göstermeden önce piyasa kalitesini doğrular.
------------------------------------------------------------------------------------------------------------------------------------------------------------
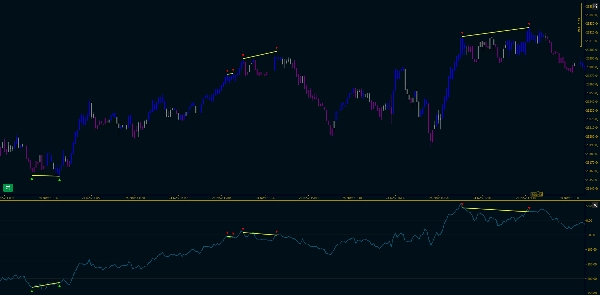
Fiyat-Delta Fraktal Analizi
------------------------------------------------------------------------------------------------------------------------------------------------------------
Hem fiyat grafiğinde hem de kümülatif deltada pivot noktalarını eş zamanlı takip eder.
Özellikler:
- Yapılandırılabilir pivot uzunlukları ile yüksek/düşük fraktalları tespit eder
- Sıralı takip: ardışık yüksekler veya ardışık düşükleri izler
- Uçurum tespiti: pivotlar arasında fiyat eğimi ile CVD eğimini karşılaştırır
- Çift görselleştirme: hem fiyat grafiğinde hem de gösterge panelinde işaretçiler ve trend çizgileri
- İsteğe Bağlı Filtre: Temiz, odaklanmış görünüm için sadece uçurumlu fraktalları göster
------------------------------------------------------------------------------------------------------------------------------------------------------------
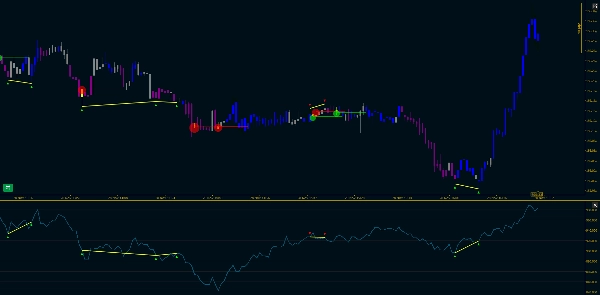
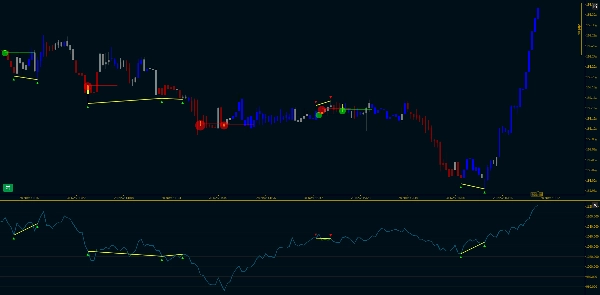
Görsel Çıktı
------------------------------------------------------------------------------------------------------------------------------------------------------------
Gösterge Paneli
- Delta Histogramı: Beyaz çubuklar (normal), Sarı çubuklar (uçurumlar)
- Kümülatif Delta Çizgisi: Sürekli emir akışını gösteren camgöbeği çizgi
- Sıfır Referans Çizgisi: Gri noktalı çizgi
- Fraktal İşaretçiler: ▼ (yüksekler) ve ▲ (düşükler) trend çizgileri ile
Fiyat Grafiği
- Renklendirilmiş Mumlar: Emir akış rejiminin görsel temsili
- Fraktal İşaretçiler: Gösterge paneli ile senkronize
- Fraktal Trend Çizgileri: Pivotları bağlar, uçurum vurgusu yapar
- Uçurum İşaretçileri: Kontrol Noktasında daireler
------------------------------------------------------------------------------------------------------------------------------------------------------------
Referanslar
------------------------------------------------------------------------------------------------------------------------------------------------------------
- Corwin, S. A., & Schultz, P. (2012). "A Simple Way to Estimate Bid-Ask Spreads from Daily High and Low Prices." The Journal of Finance, 67(2), 719-760.
- López de Prado, M. (2018). Advances in Financial Machine Learning, Bölüm 19.
- Lee, C. M., & Ready, M. J. (1991). "Inferring Trade Direction from Intraday Data." The Journal of Finance, 46(2), 733-746.