คำอธิบาย
📊 ตัวบ่งชี้ Fib Volume Delta (ฟรี)
ฟีโบนักชี, การฉายภาพ & ปริมาณเดลต้าแบบเรียลไทม์สำหรับ cTrader
🆓 ตัวบ่งชี้ Fib Volume Delta คือ ตัวบ่งชี้มืออาชีพฟรี สำหรับ cTrader ออกแบบมาเพื่อช่วยเทรดเดอร์วิเคราะห์ การย้อนกลับของฟีโบนักชี, โครงสร้างตลาด และ ปริมาณเดลต้าแบบเรียลไทม์ ในรูปแบบที่สะอาดและเข้าใจง่าย
ตัวบ่งชี้นี้เป็น รากฐาน ของ Fib Volume Delta Bot โดยให้ตรรกะเดียวกันในรูปแบบ แบบแมนนวลและมองเห็นได้.
📌 สำหรับตัวบ่งชี้ (การวิเคราะห์ด้วยตนเอง)
ประกาศเครื่องมือที่เกี่ยวข้อง
ตัวบ่งชี้นี้เป็นรากฐานการวิเคราะห์ของ Fib Volume Delta Bot ซึ่งเป็นโซลูชันการซื้อขายอัตโนมัติที่สร้างขึ้นบนตรรกะฟีโบนักชีและปริมาณเดลต้าที่เหมือนกันในขณะที่ตัวบ่งชี้ถูกออกแบบมาเพื่อการวิเคราะห์ด้วยตนเองและสนับสนุนการตัดสินใจ cBot จะเปลี่ยนตรรกะนี้เป็นกลยุทธ์อัตโนมัติเต็มรูปแบบพร้อมการจัดการความเสี่ยงและการซื้อขายขั้นสูง https://ctrader.com/it/products//3006/?u=Labot
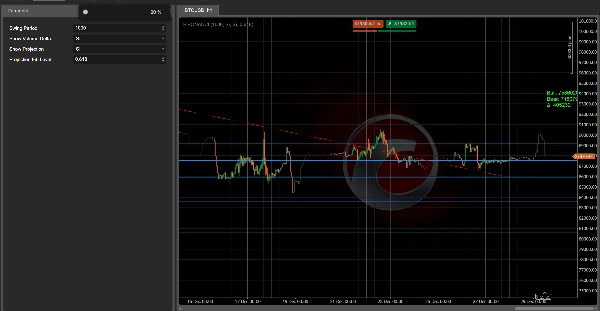
🔍 ตัวบ่งชี้ทำอะไร
ตัวบ่งชี้จะทำงานโดยอัตโนมัติ:
✅ ตรวจจับ จุดสูงสุดและต่ำสุดของสวิง
✅ วาด ระดับฟีโบนักชีสำคัญ
✅ คำนวณ ปริมาณเดลต้าจริง (ปริมาณแท็กกระทิงเทียบกับหมี)
✅ ฉายภาพเป้าหมายราคาที่เป็นไปได้โดยใช้ การฉายภาพฟีโบนักชี
✅ ใช้งานได้กับ Forex, Crypto, ดัชนี
ไม่มีการวาดซ้ำ
ไม่มีปริมาณจำลอง
ไม่มีความยุ่งเหยิง
🧮 คุณสมบัติหลัก
📐 โครงสร้างฟีโบนักชี
- การตรวจจับช่วงราคาปัจจุบันโดยอัตโนมัติ
- ระดับฟีโบนักชีที่วาดแบบไดนามิก:
-
- 23.6%
- 38.2%
- 50.0%
- 61.8%
- 78.6%
- ตรรกะกระทิงหรือหมีขึ้นอยู่กับลำดับสวิง
🔮 การฉายภาพฟีโบนักชี
- ตัวเลือก เส้นฉายภาพ เพื่อประเมินเป้าหมายราคาที่จะเกิดขึ้น
- ใช้ช่วงสวิงเดียวกัน
- เหมาะสำหรับ:
-
- การวางแผนทำกำไร
- การประเมินความเสี่ยง/ผลตอบแทน
- การวิเคราะห์สถานการณ์
📊 ปริมาณเดลต้าจริง
- คำนวณ ปริมาณแท็กกระทิงเทียบกับหมี
- แสดง:
-
- ปริมาณกระทิง
- ปริมาณหมี
- เดลต้า (กระทิง − หมี)
- ช่วยระบุ:
-
- การดูดซับ
- ความแตกต่าง
- ความแข็งแกร่งหรือความอ่อนแอเบื้องหลังการเคลื่อนไหว
⚠️ ใช้ ปริมาณแท็กจริง ไม่ใช่ข้อมูลจำลอง
⚙️ คำอธิบายพารามิเตอร์
🧭 การตรวจจับสวิง
- 🔢 ช่วงสวิง
-
- จำนวนแท่งที่ใช้ตรวจจับจุดสูงสุดและต่ำสุดของสวิง
- ค่าสูงกว่าจะได้โครงสร้างที่มั่นคงกว่า
- ค่าต่ำกว่าจะได้โครงสร้างที่ตอบสนองเร็วกว่า
📊 ปริมาณเดลต้า
- 👁 แสดงปริมาณเดลต้า
-
- เปิด/ปิดข้อความปริมาณเดลต้าบนกราฟ
🔮 การฉายภาพ
- 📈 แสดงการฉายภาพ
-
- เปิด/ปิดการฉายภาพฟีโบนักชี
- 📐 ระดับฟีโบนักชีสำหรับการฉายภาพ
🧠 วิธีใช้
✔ ระบุโซนการย้อนกลับที่สำคัญ
✔ ยืนยันการเข้าเทรดด้วยปริมาณเดลต้า
✔ ฉายภาพเป้าหมายที่สมจริง
✔ รวมกับการเคลื่อนไหวของราคา หรือ ตัวกรองแนวโน้ม
✔ เหมาะสำหรับ การเทรดด้วยตนเอง หรือ เวิร์กโฟลว์กึ่งอัตโนมัติ
🤖 เวิร์กโฟลว์ตัวบ่งชี้ + บอท
ตัวบ่งชี้นี้เป็น ฐานภาพและการวิเคราะห์ ของ Fib Volume Delta Bot:
- 📊 ตัวบ่งชี้ → การวิเคราะห์ & การยืนยัน
- ⚙️ cBot → การดำเนินการ, การจัดการความเสี่ยง & การทำงานอัตโนมัติ
คุณสามารถ:
- ใช้ตัวบ่งชี้เพียงอย่างเดียว (การเทรดด้วยตนเอง)
- หรือจับคู่กับ cBot เพื่อการทำงานอัตโนมัติเต็มรูปแบบ
🆓 ฟรี & โปร่งใส
✔ ฟรีอย่างสมบูรณ์ 100%
✔ ไม่มีฟีเจอร์ล็อก
✔ ไม่มีการพึ่งพาภายนอก
✔ ออกแบบมาสำหรับเทรดเดอร์มืออาชีพ
⚠️ ข้อจำกัดความรับผิดชอบ
ตัวบ่งชี้นี้ ไม่สร้างสัญญาณด้วยตัวเอง.
เป็น เครื่องมือสนับสนุนการตัดสินใจ ที่ควรใช้ร่วมกับการจัดการความเสี่ยงและบริบทของตลาดอย่างเหมาะสม
สรุป
Key features include dynamic Fibonacci level drawing based on current price ranges, real tick volume data (not simulated), and a clean, non-repainting interface. Users can customize swing detection sensitivity, toggle volume delta display, and enable or disable projection lines with selectable Fibonacci extension levels.
This indicator serves as the analytical foundation for the Fib Volume Delta Bot, an automated trading solution that applies the same logic for trade execution and risk management. It is intended as a decision-support tool to identify retracement zones, confirm entries with volume delta, and project realistic targets, suitable for manual or semi-automated trading workflows.