คำอธิบาย
ภาพรวม
ตัวบ่งชี้ Waddah Attar Explosion (WAE) ถูกสร้างขึ้นโดย Ahmad Waddah Attar และแนะนำให้กับชุมชนการเทรดในปี 2007 มันผสมผสานการวัดโมเมนตัม MACD กับการวิเคราะห์ความผันผวนของ Bollinger Bands เพื่อระบุช่วงเวลาที่เกิด "การระเบิดของราคา" — ช่วงเวลาที่ราคาย้ายจากการรวมตัวเข้าสู่การเคลื่อนไหวในทิศทางที่แข็งแกร่ง
ตัวบ่งชี้ตอบคำถามสองข้อ:
- โมเมนตัมกำลังสร้างขึ้นหรือไม่? (วัดโดยอัตราการเปลี่ยนแปลงของ MACD)
- ความผันผวนกำลังขยายตัวหรือไม่? (วัดโดยความกว้างของ Bollinger Bands)
เมื่อทั้งสองเงื่อนไขสอดคล้องกันเหนือฟิลเตอร์เสียงรบกวน (Dead Zone) จะเป็นสัญญาณของการเคลื่อนไหวที่อาจระเบิดได้
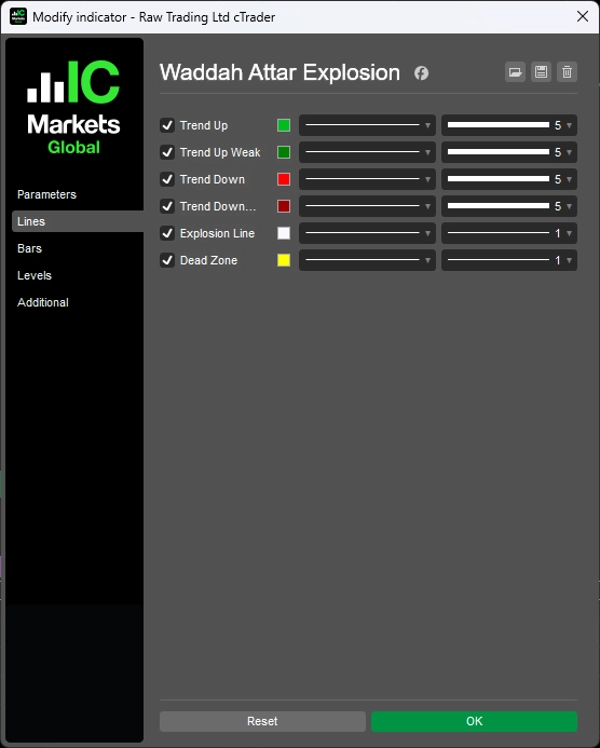
ส่วนประกอบ
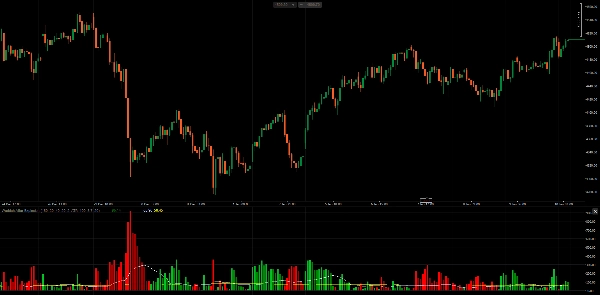
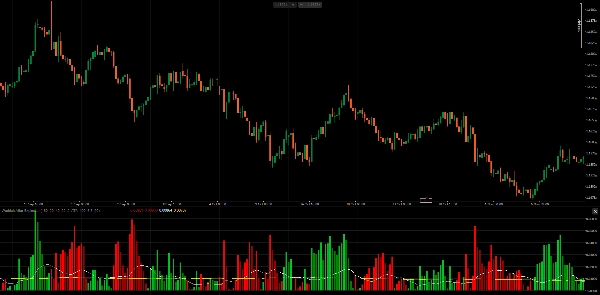
1. ฮิสโตแกรมแนวโน้ม (สีเขียว/แดง) แสดงอัตราการเปลี่ยนแปลงของเส้น MACD คูณด้วยปัจจัยความไว
- การคำนวณ:
(MACD_current - MACD_previous) × Sensitivity - แท่งสีเขียว: โมเมนตัมขาขึ้น (MACD เร่งขึ้น)
- แท่งสีแดง: โมเมนตัมขาลง (MACD เร่งลง)
- สีสว่าง: โมเมนตัมเพิ่มขึ้นเมื่อเทียบกับแท่งก่อนหน้า
- สีเข้ม: โมเมนตัมลดลงเมื่อเทียบกับแท่งก่อนหน้า
2. เส้นระเบิด (สีขาว) แสดงความกว้างของ Bollinger Bands ซึ่งบ่งชี้การขยายตัวหรือการหดตัวของความผันผวน
- การคำนวณ:
BB_Upper - BB_Lower - กำลังเพิ่มขึ้น: ความผันผวนขยายตัว (มีโอกาสเบรกเอาต์)
- กำลังลดลง: ความผันผวนหดตัว (การรวมตัว)
3. โซนตาย (สีเหลือง) ตัวกรองเกณฑ์เพื่อกำจัดสัญญาณอ่อนที่เกิดจากเสียงรบกวนของตลาด
- อิง ATR: ปรับให้เข้ากับความผันผวนของตลาดปัจจุบัน
- พิกัดคงที่: ค่าขีดจำกัดแบบคงที่
วิธีที่ Ahmad Waddah Attar ใช้
ตามผู้เขียนต้นฉบับ:
กฎการเข้าซื้อ ต้องเป็นไปตามเงื่อนไขทั้งหมด:
- ฮิสโตแกรมสีเขียวกำลังเพิ่มขึ้น
- ฮิสโตแกรมสีเขียวอยู่เหนือเส้นระเบิด
- เส้นระเบิดกำลังเพิ่มขึ้น
- ทั้งฮิสโตแกรมสีเขียวและเส้นระเบิดอยู่เหนือโซนตาย
กฎการเข้าขาย ต้องเป็นไปตามเงื่อนไขทั้งหมด:
- ฮิสโตแกรมสีแดงกำลังเพิ่มขึ้น
- ฮิสโตแกรมสีแดงอยู่เหนือเส้นระเบิด
- เส้นระเบิดกำลังเพิ่มขึ้น
- ทั้งฮิสโตแกรมสีแดงและเส้นระเบิดอยู่เหนือโซนตาย
กฎการออก
- ออกจากสถานะซื้อเมื่อฮิสโตแกรมสีเขียวตัดลงต่ำกว่าเส้นระเบิด
- ออกจากสถานะขายเมื่อฮิสโตแกรมสีแดงตัดลงต่ำกว่าเส้นระเบิด
ข้อมูลเชิงลึกสำคัญ มุมของเส้นระเบิดมีความสำคัญ เมื่อเส้นระเบิดมีมุมขึ้นและฮิสโตแกรมทะลุขึ้นเหนือเส้นนี้ จะยืนยันว่าความผันผวนกำลังเพิ่มขึ้นอย่างแท้จริง — "การระเบิด" เป็นของจริง ไม่ใช่สัญญาณเท็จ
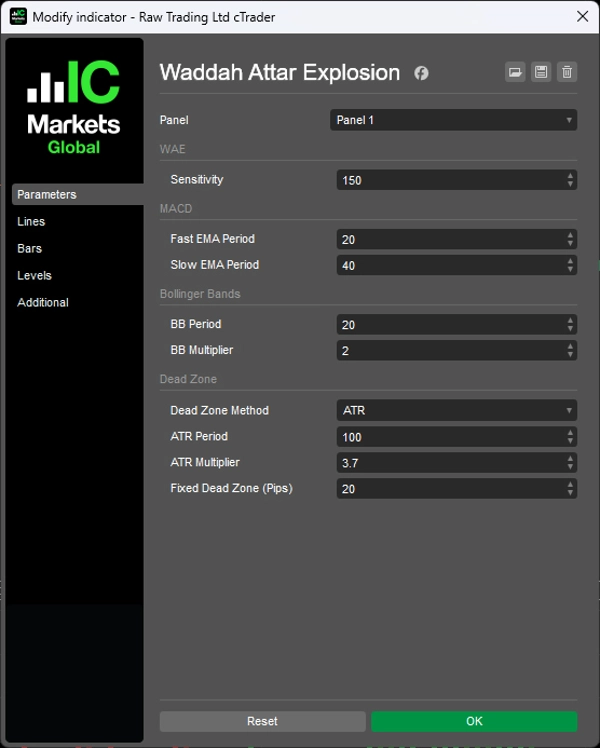
พารามิเตอร์
1. ความไว
- ความไว (150): ตัวคูณสำหรับอัตราการเปลี่ยนแปลงของ MACD
2. MACD
- ช่วง EMA เร็ว (20): ค่าเฉลี่ยเคลื่อนที่เร็วสำหรับการคำนวณ MACD
- ช่วง EMA ช้า (40): ค่าเฉลี่ยเคลื่อนที่ช้าสำหรับการคำนวณ MACD
3. Bollinger Bands
- ช่วง BB (20): ช่วงเวลาย้อนหลังของ Bollinger Bands
- ตัวคูณ BB (2.0): ตัวคูณส่วนเบี่ยงเบนมาตรฐาน
4. โซนตาย
- วิธีโซนตาย (ATR): เลือกระหว่างอิง ATR หรือ พิกัดคงที่
- ช่วง ATR (100): ช่วงเวลาสำหรับการคำนวณ ATR
- ตัวคูณ ATR (3.7): ตัวคูณที่ใช้กับ ATR สำหรับโซนตาย
- โซนตายคงที่ (20): ค่าของโซนตายในหน่วยพิปส์ (เมื่อใช้วิธีคงที่)
หมายเหตุ
- ตัวบ่งชี้นี้ทำงานได้กับทุกกรอบเวลา ผู้เขียนต้นฉบับแนะนำ H1 และ M30
- โซนตายแบบอิง ATR แนะนำให้ใช้เพราะปรับให้เข้ากับเครื่องมือและสภาพตลาดที่แตกต่างกันได้
- พารามิเตอร์ความไวอาจต้องปรับตามกรอบเวลาและความผันผวนของเครื่องมือ
- ตัวบ่งชี้นี้ระบุการสอดคล้องของโมเมนตัมและความผันผวน — ไม่ได้ทำนายทิศทางด้วยตัวเอง ควรใช้ร่วมกับการวิเคราะห์แนวโน้มหรือระดับแนวรับ/แนวต้าน
__________________________________________________________________________________________
ตัวบ่งชี้ฟรีเพิ่มเติม
สำรวจเครื่องมือวิเคราะห์ตลาดหลากหลายประเภท — ตั้งแต่โครงสร้างและปริมาณไปจนถึงการถดถอย ความผันผวน และกรอบเวลาที่กำหนดเอง
ซอร์สโค้ดมีให้บน GitHub repository.
ทั้งหมดใช้ฟรี แต่ถ้าคุณต้องการสนับสนุนด้วยกาแฟ คุณสามารถส่งได้ ที่นี่.
แนวรับ/แนวต้าน
ปริมาณ
- Volume Activity Profiler
- Volume Efficiency Analyzer
- Volume Profile Analytics
- Volume Profile - Updated
- Volume Spread Analysis
- VWAP (Volume Weighted Average Price)
ค่าเฉลี่ยเคลื่อนที่
- SSL Channel
- Anchored Moving Average
- Deviation-Scaled Moving Average
- Gann High Low Activator
- Instantaneous Trendline
- Kaufman Adaptive MA with Trend Vision
- Moving Average Channel
- Moving Averages Suite
- Trend Channel Moving Average
ยูทิลิตี้/กำหนดเอง
อิงการถดถอย
ความผันผวน
ออสซิลเลเตอร์
__________________________________________________________________________________________
ข้อจำกัดความรับผิดชอบ
การเทรดมีความเสี่ยง ตัวบ่งชี้นี้มีไว้สำหรับการวิเคราะห์ทางเทคนิคเท่านั้น — โปรดใช้การจัดการความเสี่ยงอย่างเหมาะสมและเทรดอย่างรับผิดชอบเสมอ
ข้อเสนอแนะ & การปรับปรุง
หากคุณมีข้อเสนอแนะ คำขอฟีเจอร์ หรือไอเดียสำหรับการปรับปรุง กรุณาแสดงความคิดเห็นในแท็บ Discussion ข้อเสนอแนะของคุณช่วยพัฒนาตัวบ่งชี้ให้ดียิ่งขึ้นสำหรับทุกคน