
คำอธิบาย
3-Bar Reversal
📊 มันคืออะไร?
The 3-Bar Reversal เป็นตัวชี้วัดทางเทคนิคที่ระบุรูปแบบการกลับตัวเฉพาะที่เกิดจากแท่งเทียนสามแท่งติดต่อกันอย่างแม่นยำ รูปแบบคลาสสิกนี้ส่งสัญญาณการเปลี่ยนแปลงทิศทางราคาที่เป็นไปได้ผ่านโครงสร้างภาพที่ชัดเจน: แท่งเทรนด์ แท่งเทียนหมดแรง และแท่งเทียนกลับตัว
🎯 ใช้ทำอะไร?
ตัวชี้วัดนี้ช่วยให้นักเทรดสามารถ:
- ตรวจจับการกลับตัวขาขึ้นและขาลง ด้วยโครงสร้าง 3 แท่งเทียน
- กรองสัญญาณเท็จ ผ่านการยืนยันแนวโน้มที่ปรับแต่งได้
- ระบุโซนแนวรับและแนวต้าน ตามรูปแบบที่ได้รับการยืนยัน
- แสดงโอกาสในการเทรด ด้วยเครื่องหมายบนกราฟที่เข้าใจง่าย
- เทรดการกลับตัวที่มีความน่าจะเป็นสูง ในทุกกรอบเวลา
🔍 มันทำงานอย่างไร?
รูปแบบขาขึ้น (3-Bar Bullish Reversal)
โครงสร้างสามแท่งเทียน:
- แท่งเทียน 1 (ขาลง): ปิดต่ำกว่าราคาเปิด - ยืนยันแรงขาย
- แท่งเทียน 2 (ขาลงหมดแรง): ทำจุดต่ำสุดใหม่และจุดสูงสุดใหม่ต่ำกว่าแท่งเทียน 1 พร้อมปิดแบบขาลง - สัญญาณยอมแพ้ ⚠️
- แท่งเทียน 3 (กลับตัวขาขึ้น): ปิดสูงกว่าราคาเปิดและสูงกว่าจุดสูงสุดของแท่งเทียน 1 - ยืนยันการเปลี่ยนแปลงการควบคุม ✅
รูปแบบขาลง (3-Bar Bearish Reversal)
โครงสร้างตรงกันข้าม:
- แท่งเทียน 1 (ขาขึ้น): ปิดสูงกว่าราคาเปิด - ยืนยันแรงซื้อ
- แท่งเทียน 2 (ขาขึ้นขยายตัว): ทำจุดสูงสุดใหม่และจุดต่ำสุดใหม่สูงกว่าแท่งเทียน 1 พร้อมปิดแบบขาขึ้น - สัญญาณขยายตัวเกิน ⚠️
- แท่งเทียน 3 (กลับตัวขาลง): ปิดต่ำกว่าราคาเปิดและต่ำกว่าจุดต่ำสุดของแท่งเทียน 1 - ยืนยันการเปลี่ยนแปลงการควบคุม ✅
ระบบการจัดการภาพ (เครื่องสถานะ)
ตัวชี้วัดประมวลผลแต่ละรูปแบบในสามขั้นตอนต่อเนื่อง:
ขั้นตอนที่ 1 - การตรวจจับรูปแบบ: 🔍
- ระบุโครงสร้างแท่งเทียน 3 แท่งครบถ้วน
- A triangle indicator (▲ ขาขึ้น / ▼ ขาลง) ปรากฏบนแท่งเทียนที่สาม
- A semi-transparent setup rectangle ถูกวาดครอบคลุม:
-
- ขาขึ้น: จากจุดสูงสุดของแท่งเทียน 1 ถึงจุดต่ำสุดที่สุด (แท่งเทียน 2 หรือ 3)
- ขาลง: จากจุดต่ำสุดของแท่งเทียน 1 ถึงจุดสูงสุดที่สุด (แท่งเทียน 2 หรือ 3)
- สี่เหลี่ยมนี้เป็นเครื่องหมาย "โซนการต่อสู้" ที่เกิดการกลับตัว
ขั้นตอนที่ 2 - การยืนยันหรือการปฏิเสธ: ⏳
ระบบรอแท่งเทียนถัดไปหลังรูปแบบเพื่อยืนยัน:
การยืนยันขาขึ้น: ✅
- ราคาปิดของแท่งเทียนถัดไปต้องสูงกว่าจุดสูงสุดของแท่งเทียน 1 (เพดานสี่เหลี่ยม)
- A จุดทึบ (●) ปรากฏขึ้นเพื่อแสดงการยืนยัน
- สี่เหลี่ยมกลายเป็นโซนแนวรับที่ใช้งานได้
การยืนยันขาลง: ✅
- ราคาปิดของแท่งเทียนถัดไปต้องต่ำกว่าจุดต่ำสุดของแท่งเทียน 1 (พื้นสี่เหลี่ยม)
- A จุดทึบ (●) ปรากฏขึ้นเพื่อแสดงการยืนยัน
- สี่เหลี่ยมกลายเป็นโซนแนวต้านที่ใช้งานได้
การปฏิเสธ: ❌
- ขาขึ้นล้มเหลวถ้า: ปิดต่ำกว่าค่าต่ำสุดของสี่เหลี่ยมหรือมีรูปแบบขาลงปรากฏ
- ขาลงล้มเหลวถ้า: ปิดสูงกว่าค่าสูงสุดของสี่เหลี่ยมหรือมีรูปแบบขาขึ้นปรากฏ
- สี่เหลี่ยมหยุดขยาย (รูปแบบตาย)
การขยายรอคอย: ⏸️
- ถ้าไม่มีการยืนยันหรือการล้มเหลว สี่เหลี่ยมจะขยายตัวในแนวนอนทีละแท่งเทียน
ขั้นตอนที่ 3 - โซนแนวรับ/แนวต้านที่ใช้งาน: 🎯
- เมื่อได้รับการยืนยัน โซนจะขยายไปทางขวาอย่างไม่มีกำหนด
- โซนขาขึ้น: ยังคงใช้งานได้ตราบใดที่ราคายังคงอยู่เหนือพื้น
- โซนขาลง: ยังคงใช้งานได้ตราบใดที่ราคายังคงอยู่ต่ำกว่าเพดาน
- โซนจะถูกปิดใช้งานเมื่อราคาทะลุโซนอย่างสมบูรณ์ในทิศทางตรงกันข้าม
⚙️ การตั้งค่าหลัก
โหมดรูปแบบ
ควบคุมว่ารูปแบบใดที่ยอมรับ:
- ปกติ: ยอมรับเฉพาะเมื่อแท่งเทียนที่ 3 ปิดภายในช่วงของแท่งเทียน 1
-
- ขาขึ้น: ปิด < จุดสูงสุดของแท่งเทียน 1 (กลับตัวปานกลาง)
- ขาลง: ปิด > จุดต่ำสุดของแท่งเทียน 1 (กลับตัวปานกลาง)
- ปรับปรุง: ยอมรับเฉพาะเมื่อแท่งเทียนที่ 3 ปิดนอกช่วงของแท่งเทียน 1 🔥
-
- ขาขึ้น: ปิด > จุดสูงสุดของแท่งเทียน 1 (กลับตัวรุนแรง)
- ขาลง: ปิด < จุดต่ำสุดของแท่งเทียน 1 (กลับตัวรุนแรง)
- ทั้งหมด (แนะนำ): ยอมรับทั้งสองประเภทโดยไม่แยกแยะ ⭐
ประเภทแนวรับ/แนวต้าน
- ระดับ: ฟังก์ชันเส้นพื้นฐาน (จำกัดในเวอร์ชันนี้)
- โซน: วาดสี่เหลี่ยมเงาเพื่อแสดงโซน SR หลังการยืนยัน 📦
- ไม่มี: ไม่มีโซน SR แสดงเฉพาะรูปแบบที่ตรวจพบ
สีที่ปรับแต่งได้ 🎨
- สีกลับตัวขาขึ้น: สำหรับสามเหลี่ยม สี่เหลี่ยม และโซนขาขึ้น (ค่าเริ่มต้น:
#2962FF- สีน้ำเงิน) - สีกลับตัวขาลง: สำหรับสามเหลี่ยม สี่เหลี่ยม และโซนขาลง (ค่าเริ่มต้น:
#FF9800- สีส้ม) - สีแนวโน้มขาขึ้น: สำหรับการแสดงผลตัวกรองแนวโน้ม (ค่าเริ่มต้น:
#089981- สีเขียว) - สีแนวโน้มขาลง: สำหรับการแสดงผลตัวกรองแนวโน้ม (ค่าเริ่มต้น:
#F23645- สีแดง)
🔧 ตัวกรองแนวโน้ม
ตัวชี้วัดสามารถกรองรูปแบบตามทิศทางแนวโน้มโดยรวมโดยใช้สี่วิธี:
1. เมฆค่าเฉลี่ยเคลื่อนที่ ☁️
ใช้ค่าเฉลี่ยเคลื่อนที่สองค่าเพื่อระบุแนวโน้ม:
พารามิเตอร์:
- ประเภทค่าเฉลี่ยเคลื่อนที่: แบบง่าย, แบบเลขชี้กำลัง, Hull, ถ่วงน้ำหนัก ฯลฯ (ค่าเริ่มต้น: Hull)
- ช่วงเร็ว: 50 (ค่าเริ่มต้น)
- ช่วงช้า: 200 (ค่าเริ่มต้น)
ตรรกะตัวกรอง (สอดคล้อง):
- ตรวจจับแนวโน้มขาขึ้นเมื่อ: ราคาสูงกว่า MA เร็ว และ MA เร็วสูงกว่า MA ช้า ✅
- ตรวจจับแนวโน้มขาลงเมื่อ: ราคาต่ำกว่า MA เร็ว และ MA เร็วต่ำกว่า MA ช้า ✅
- แสดงเฉพาะรูปแบบขาขึ้นในแนวโน้มขาขึ้นและรูปแบบขาลงในแนวโน้มขาลง
ตรรกะตรงข้าม (ตรงกันข้าม):
- กลับเงื่อนไขเพื่อจับการกลับตัวแนวโน้มหลักที่ตรงกันข้าม
2. Supertrend 📈
ตัวชี้วัดติดตามแนวโน้มโดยใช้ความผันผวน (ATR):
พารามิเตอร์:
- ช่วง ATR: 10 (ค่าเริ่มต้น) - หน้าต่างการคำนวณความผันผวน
- ตัวคูณ: 3.0 (ค่าเริ่มต้น) - ความไวของตัวชี้วัด
ตรรกะ:
- คำนวณแถบบนและล่างโดยใช้ ATR
- ราคาสูงกว่า Supertrend = แนวโน้มขาขึ้น 🟢
- ราคาต่ำกว่า Supertrend = แนวโน้มขาลง 🔴
- กรองรูปแบบตามการจัดตำแหน่งที่ตั้งค่าไว้
3. Donchian Channels 📊
ใช้ราคาสูงสุดและต่ำสุดในช่วงระยะเวลา:
พารามิเตอร์:
- ความยาวช่อง: 13 (ค่าเริ่มต้น)
ตรรกะ:
- ช่องบน = จุดสูงสุดสูงสุดของช่วง N
- ช่องล่าง = จุดต่ำสุดต่ำสุดของช่วง N
- จุดกึ่งกลาง = (บน + ล่าง) / 2
- ราคาสูงกว่าจุดกึ่งกลาง = แนวโน้มขาขึ้น 🟢
- ราคาต่ำกว่าจุดกึ่งกลาง = แนวโน้มขาลง 🔴
4. ไม่มี (ไม่กรอง) 🔓
แสดงรูปแบบ 3 แท่งทั้งหมดที่ตรวจพบโดยไม่พิจารณาแนวโน้มโดยรวม เหมาะสำหรับ:
- ตลาดที่เคลื่อนไหวในกรอบ
- การวิเคราะห์รูปแบบบริสุทธิ์
- การเทรดกลับตัวในทุกบริบท
การจัดตำแหน่งแนวโน้ม
ใช้เมื่อเปิดใช้งานตัวกรอง:
- สอดคล้อง: แสดงเฉพาะรูปแบบที่ไปในทิศทางเดียวกับแนวโน้มที่ระบุ ➡️
-
- รูปแบบขาขึ้นเฉพาะในแนวโน้มขาขึ้น
- รูปแบบขาลงเฉพาะในแนวโน้มขาลง
- ตรงกันข้าม: แสดงเฉพาะรูปแบบที่ไปในทิศทางตรงกันข้ามกับแนวโน้มที่ระบุ 🔄
-
- รูปแบบขาขึ้นในแนวโน้มขาลง (กลับตัวใหญ่)
- รูปแบบขาลงในแนวโน้มขาขึ้น (กลับตัวใหญ่)
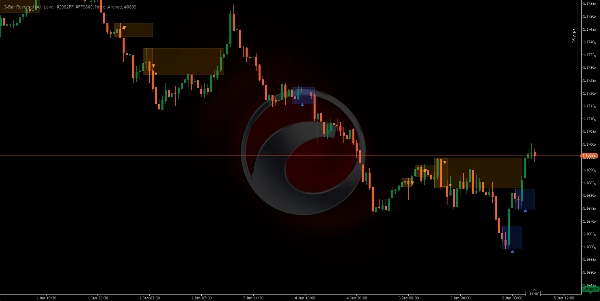
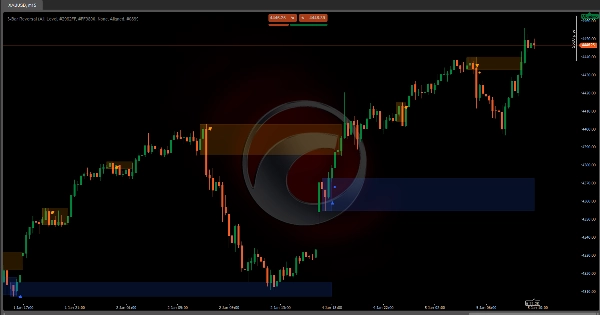
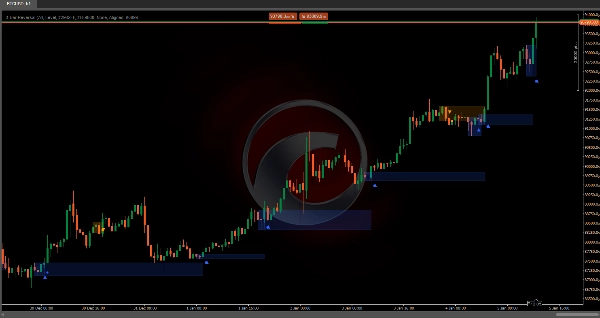
สรุป
It operates in three phases: pattern detection, confirmation or invalidation based on the next candle's behavior, and establishing active support or resistance zones that extend while price respects them. The indicator supports configurable pattern modes (Normal, Enhanced, or All) to control acceptance criteria for reversals.
Trend filtering is available through four methods—Moving Average Cloud, Supertrend, Donchian Channels, or no filter—allowing users to align pattern signals with overall market trends or capture counter-trend reversals. Confirmed reversal zones are displayed as shaded rectangles or levels, customizable in color for bullish and bearish signals, trend filters, and zones.
This tool is designed for use on any timeframe and across various markets, including forex pairs (EURUSD, GBPUSD, USDJPY, NZDUSD), commodities (XAUUSD), indices (NAS100), and cryptocurrencies (BTCUSD). It aids traders in detecting high-probability reversals, filtering false signals, and identifying support and resistance zones with clear visual markers.


