

คำอธิบาย
Smart Money Suite Pro — ชุดเครื่องมือการเคลื่อนไหวราคาสถาบันครบวงจรสำหรับ cTrader
หากคุณเทรดโดยใช้แนวคิดสมาร์ทมันนี่หรือวิธีการเคลื่อนไหวราคาที่มีรากฐานจากการไหลของคำสั่งสถาบัน คุณจะรู้ถึงความยุ่งยาก: ตัวชี้วัดหลายสิบตัวกระจัดกระจายอยู่ทั่วแผนภูมิของคุณ แต่ละตัวทำงานเพียงบางส่วน ไม่มีตัวไหนสื่อสารกัน Smart Money Suite Pro ถูกสร้างขึ้นมาเพื่อแก้ปัญหานี้อย่างสมบูรณ์
นี่คือตัวชี้วัดเดียวที่ครบถ้วนในตัวเอง ครอบคลุมทุกแนวคิดหลักในวิธีการเคลื่อนไหวราคาสถาบันและสมาร์ทมันนี่ — ออกแบบตั้งแต่ต้นสำหรับ cTrader ปรับแต่งให้ทำงานได้อย่างราบรื่นบนแผนภูมิสดโดยไม่มีการกะพริบ และเต็มไปด้วยฟีเจอร์ที่ช่วยให้ใช้งานได้จริงในช่วงการเทรดจริง
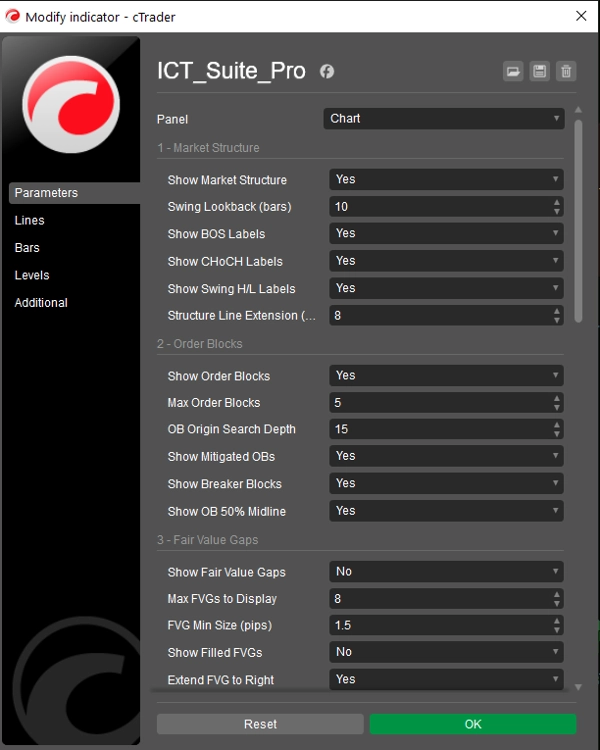
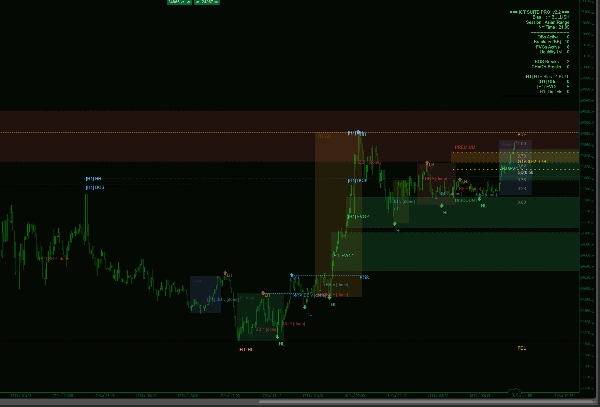
โครงสร้างตลาด — อัตโนมัติและแม่นยำ
ตัวชี้วัดจะสแกนแผนภูมิของคุณอย่างต่อเนื่องเพื่อหาจุดสูงสุดและต่ำสุดที่ได้รับการยืนยัน โดยจัดประเภทแต่ละจุดเป็น Higher High, Lower High, Higher Low หรือ Lower Low การเบรกโครงสร้าง (BOS) และการเปลี่ยนแปลงลักษณะ (CHoCH) ทุกครั้งจะถูกตรวจจับและติดป้ายด้วยเส้นระดับแบบจุดเพื่อให้คุณเห็นได้ชัดเจนว่าราคาทะลุโครงสร้างก่อนหน้าในจุดใด ความแตกต่างระหว่าง BOS (แนวโน้มต่อเนื่อง) และ CHoCH (แนวโน้มกลับตัว) ถูกระบุด้วยสีเพื่อให้อ่านได้ทันทีในสายตา ความลึกของการมองย้อนกลับของสวิงสามารถปรับได้อย่างเต็มที่
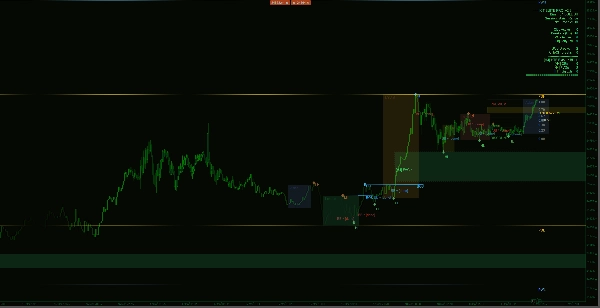
บล็อกคำสั่ง — พร้อมการติดตามวงจรชีวิตเต็มรูปแบบ
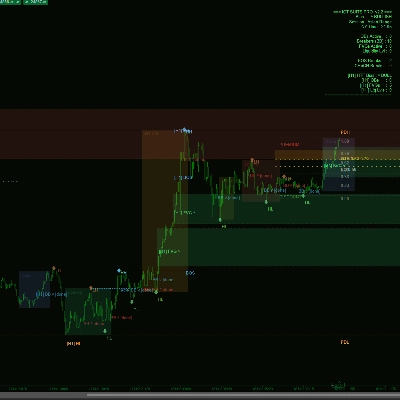
บล็อกคำสั่งถูกระบุโดยการหาค่าแท่งเทียนตรงข้ามสุดท้ายก่อนการเคลื่อนไหวแบบอิมพัลส์แต่ละครั้งที่นำไปสู่สวิงที่ได้รับการยืนยัน แต่ละบล็อกถูกวาดเป็นกล่องสีที่ขยายไปทางขวาของแผนภูมิ เพื่อให้คุณเห็นได้ทันทีว่าราคากลับมายังโซนหรือไม่ เมื่อบล็อกคำสั่งถูกบรรเทา สี่เหลี่ยมจะถูกลบและแทนที่ด้วยเครื่องหมายข้อความจาง ๆ — เพื่อรักษาความสะอาดของแผนภูมิในขณะที่เก็บบันทึกระดับไว้ เมื่อราคาละเมิดผ่านอีกด้านของบล็อกคำสั่งที่บรรเทาแล้ว จะถูกจัดประเภทใหม่เป็น Breaker Block และเปลี่ยนสี เพื่อสัญญาณโซนกลับตัวที่เป็นไปได้ เส้นกึ่งกลาง 50% ถูกวาดภายในแต่ละบล็อกที่ใช้งานเพื่อเน้นการแบ่งพรีเมียม/ส่วนลดภายในโซนเอง
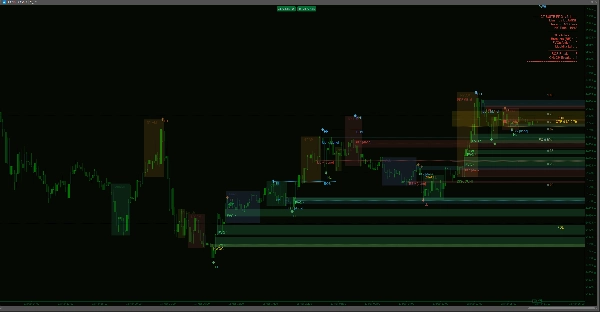
ช่องว่างมูลค่ายุติธรรม — ติดตามจนกว่าจะเติมเต็ม
ความไม่สมดุลของราคาสามแท่งเทียนถูกตรวจจับในทั้งสองทิศทางทั่วทั้งหน้าต่างการมองย้อนกลับของคุณ ช่องว่างแต่ละช่องถูกกรองด้วยขนาด pip ขั้นต่ำที่กำหนดได้เพื่อลดเสียงรบกวน ช่องว่างที่ยังไม่เติมจะขยายไปทางขวาของแผนภูมิจนกว่าราคาจะกลับมาเติมเต็ม ซึ่งในจุดนั้นจะถูกลบหรือทำเครื่องหมายว่าเติมเต็มแล้วขึ้นอยู่กับการตั้งค่าของคุณ ทั้งความไม่สมดุลแบบกระทิงและแบบหมีถูกจัดการพร้อมกัน
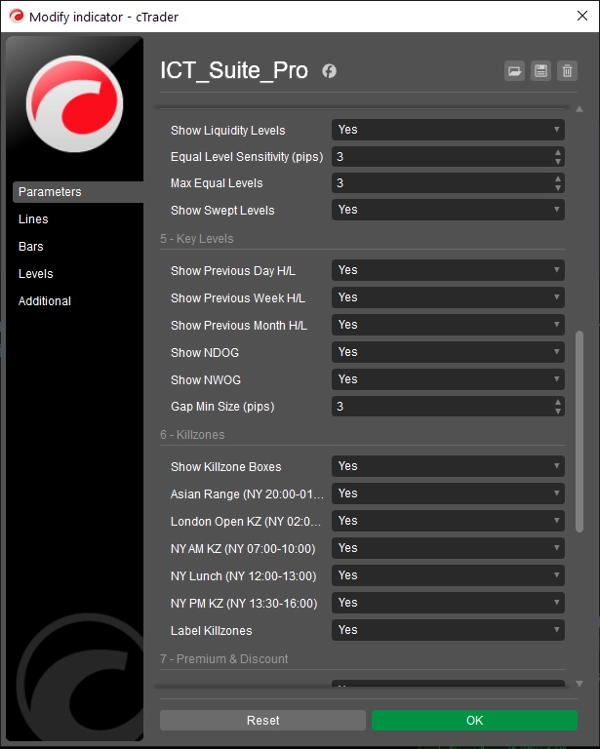
ระดับสภาพคล่อง — จุดสูงสุดเท่ากันและจุดต่ำสุดเท่ากัน
ตัวชี้วัดจะสแกนหากลุ่มของจุดสูงสุดหรือจุดต่ำสุดที่อยู่ภายในความทนทาน pip ที่กำหนดได้ของกันและกัน — ระบุแหล่งสภาพคล่องฝั่งซื้อและฝั่งขายที่การไหลของคำสั่งสถาบันมักจะมุ่งเป้าไปที่ แต่ละระดับถูกวาดด้วยเครื่องหมายติ๊กที่จุดสวิงทั้งสองและเส้นประที่ฉายไปทางขวา เมื่อราคากวาดผ่านระดับสภาพคล่องแล้ว จะถูกซ่อนไว้หรือทำเครื่องหมายว่าถูกกวาดขึ้นอยู่กับความชอบของคุณ
ระดับสำคัญ — วันก่อนหน้า สัปดาห์ และเดือน
ระดับสูง/ต่ำของวันก่อนหน้า ระดับสูง/ต่ำของสัปดาห์ก่อนหน้า และระดับสูง/ต่ำของเดือนก่อนหน้าจะถูกคำนวณโดยอัตโนมัติจากข้อมูลราคาของแผนภูมิของคุณเอง ขอบเขตวันที่ทั้งหมดมาจากเวลาของแท่งเทียนของโบรกเกอร์ — ไม่ใช่นาฬิกาของระบบท้องถิ่นของคุณ — ดังนั้นจึงยังคงถูกต้องไม่ว่าคุณจะอยู่ในโซนเวลาใดหรือมีการเปลี่ยนเครื่องมือใด ๆ คู่ระดับแต่ละคู่ใช้สีและรูปแบบเส้นที่แตกต่างกันเพื่อให้ซ้อนกันอย่างเรียบร้อยบนแผนภูมิ
ช่องว่างเปิด — รายวันและรายสัปดาห์
ตัวชี้วัดจะสแกนการเปิดรายวันและรายสัปดาห์ทุกครั้งเพื่อหาช่องว่างราคาระหว่างราคาปิดของช่วงก่อนหน้าและราคาเปิดของช่วงปัจจุบัน ช่องว่างใด ๆ ที่เกินขนาด pip ขั้นต่ำที่คุณกำหนดจะถูกวาดเป็นสี่เหลี่ยมสี ช่องว่างเปิดวันใหม่และช่องว่างเปิดสัปดาห์ใหม่จะแยกแยะด้วยสีที่แตกต่างกัน ทำให้คุณเห็นได้ทันทีว่าช่องว่างใดยังไม่ถูกเติมเต็ม
โซนฆ่าช่วงเวลา — พร้อมกล่องช่วงจริง
ช่วงเวลาการเทรด Asian, London Open, New York AM, New York Lunch และ New York PM ถูกวาดเป็นกล่องเต็มที่ครอบคลุมช่วงสูงสุดถึงต่ำสุดที่เกิดขึ้นจริงในแต่ละช่วงเวลา เวลาอ้างอิงตามเวลานิวยอร์กและปรับอัตโนมัติสำหรับการประหยัดแสง EDT/EST กล่องแต่ละกล่องสามารถเปิดปิดและติดป้ายได้อย่างอิสระ เนื่องจากกล่องสะท้อนช่วงราคาจริงแทนที่จะเป็นเส้นแนวตั้งคงที่ คุณจึงเห็นได้ทันทีว่าช่วงเวลาใดมีความเคลื่อนไหวมากและราคาพบจุดสูงสุดต่ำสุดที่ใด
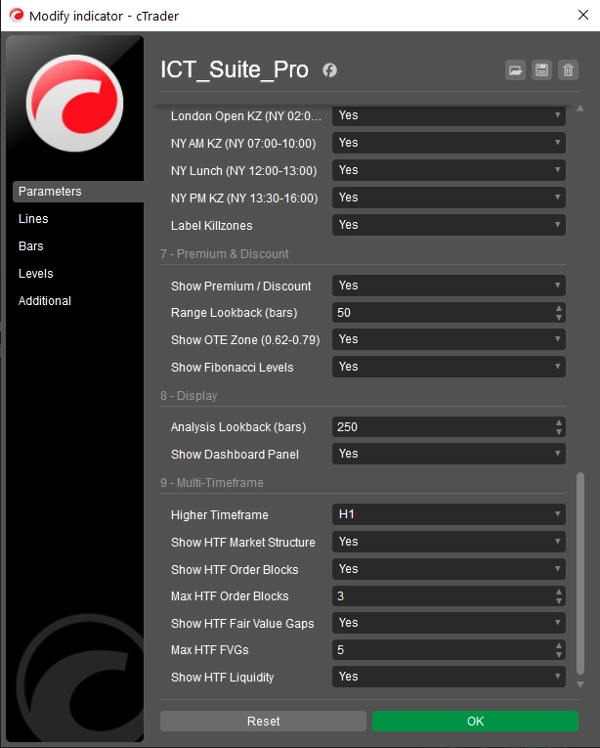
โซนพรีเมียม & ส่วนลด — พร้อมช่วงเข้าที่เหมาะสม
การวิเคราะห์ช่วงแบบเลื่อนจะคำนวณจุดสูงสุดสูงสุดและจุดต่ำสุดต่ำสุดในช่วงเวลาที่กำหนดได้ จากช่วงนี้ ตัวชี้วัดจะวาดจุดสมดุล (0.50) โซนเข้าที่เหมาะสม (ฟีโบนัชชี 0.62–0.79) และชุดระดับฟีโบนัชชีรีเทรซเมนต์หลักทั้งหมด ป้ายพรีเมียมและส่วนลดจะถูกวางไว้ภายในช่วงเพื่อให้คุณทราบเสมอว่าราคากำลังซื้อขายอยู่ในครึ่งใดของช่วงการซื้อขายปัจจุบัน การมองย้อนกลับจะถูกจำกัดโดยอัตโนมัติเพื่อให้ตรงกับหน้าต่างแท่งเทียนที่มองเห็นได้ของคุณ ดังนั้นระดับใด ๆ จะไม่อ้างอิงแท่งเทียนที่คุณไม่เห็น
การซ้อนทับหลายกรอบเวลา — ฟีเจอร์เด่น
ระบบ MTF สร้างแท่งเทียนกรอบเวลาที่สูงขึ้นโดยการรวบรวมแท่งเทียนของแผนภูมิปัจจุบันเข้ากับช่องเวลาที่จัดเรียงตามเวลา — ไม่ต้องสมัครข้อมูลแยกต่างหาก เลือกกรอบเวลาที่สูงกว่าของคุณจากเมนูแบบเลื่อนลง (M5, M15, M30, H1, H4, D1) และ Smart Money Suite Pro จะคำนวณและวาดบล็อกคำสั่ง ช่องว่างมูลค่ายุติธรรม โครงสร้างตลาด และระดับสภาพคล่องของกรอบเวลาที่สูงกว่าบนแผนภูมิปัจจุบันของคุณ รายการกรอบเวลาที่สูงกว่ามีลักษณะเด่น: ขอบหนากว่า เส้นขอบประ และป้ายที่ขึ้นต้นด้วยแท็กกรอบเวลา (เช่น [H4] OB ^) เพื่อให้คุณทราบเสมอว่าระดับใดเป็นของกรอบเวลาใด
หากคุณเลือกกรอบเวลาที่สูงกว่าซึ่งเท่ากับหรือต่ำกว่ากรอบเวลาปัจจุบันของแผนภูมิ — ซึ่งเป็นการตั้งค่าที่เป็นไปไม่ได้ — ตัวชี้วัดจะแสดงคำเตือนชัดเจนบนหน้าจอและไม่วาดอะไรเลย เพื่อป้องกันข้อมูลที่ทำให้เข้าใจผิดปรากฏขึ้น
แผงแดชบอร์ดจะอัปเดตด้วยส่วนกรอบเวลาที่สูงกว่าโดยเฉพาะเมื่อเปิดใช้งานการซ้อนทับ แสดงแนวโน้ม HTF จำนวนบล็อกคำสั่งที่ใช้งาน ช่องว่างมูลค่ายุติธรรม และจำนวนระดับสภาพคล่องควบคู่ไปกับสรุปกรอบเวลาปัจจุบัน
แดชบอร์ดสด
แผงที่สะอาดและยึดติดทางขวาจะแสดง: แนวโน้มตลาดปัจจุบัน ช่วงการเทรดที่ใช้งาน เวลานิวยอร์ก จำนวนบล็อกคำสั่งที่ใช้งาน บล็อกเบรกเกอร์ ช่องว่างมูลค่ายุติธรรม และระดับสภาพคล่อง รวมถึงจำนวนทั้งหมดของการเบรก BOS และ CHoCH ที่ตรวจพบในหน้าต่างการมองย้อนกลับ เมื่อเปิดใช้งานการซ้อนทับหลายกรอบเวลา สรุปกรอบเวลาที่สูงกว่าจะถูกเพิ่มโดยอัตโนมัติด้านล่าง
สร้างมาเพื่อการเทรดสด
ตัวชี้วัดจะวาดใหม่เฉพาะเมื่อแท่งเทียนใหม่ก่อตัว — ไม่ใช่ทุกครั้งที่มีการเคลื่อนไหวของราคา — ช่วยขจัดการกะพริบของแผนภูมิที่ส่งผลกระทบต่อตัวชี้วัดแบบ all-in-one หลายตัว การวิเคราะห์ทั้งหมดทำงานภายในหน้าต่างการมองย้อนกลับที่ปรับได้เพื่อให้ประสิทธิภาพคงที่แม้ในกรอบเวลาที่ต่ำกว่าที่มีจำนวนแท่งเทียนมาก


