ADX advanced
Indicatore
Versione 1.0, Apr 2026
Windows, Mac
4.3
Recensioni: 3
Descrizione
ADX Advanced Cloud & Momentum System
L'indice direzionale medio standard (ADX) è uno strumento potente, ma diciamolo chiaramente: fissare tre linee che si intersecano (+DI, -DI e ADX) è caotico, confuso e affatica gli occhi.
L'indicatore avanzato ADX modernizza completamente questo strumento classico. Trasforma le linee caotiche in una potenza visiva chiara che ti dice esattamente CHI è al comando (tori contro orsi) e QUANTO È FORTE il trend, tutto con un solo sguardo.
Caratteristiche principali
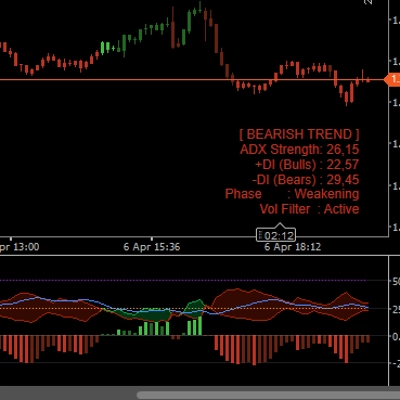
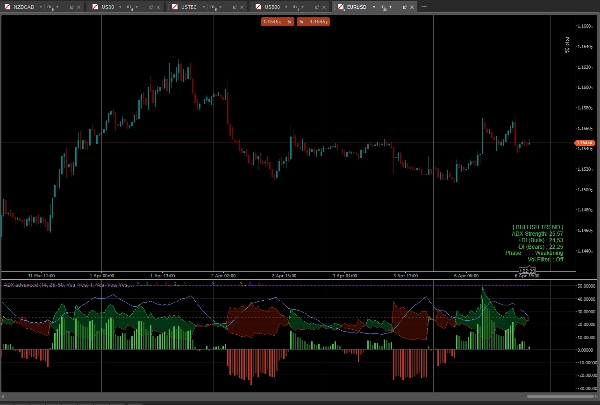
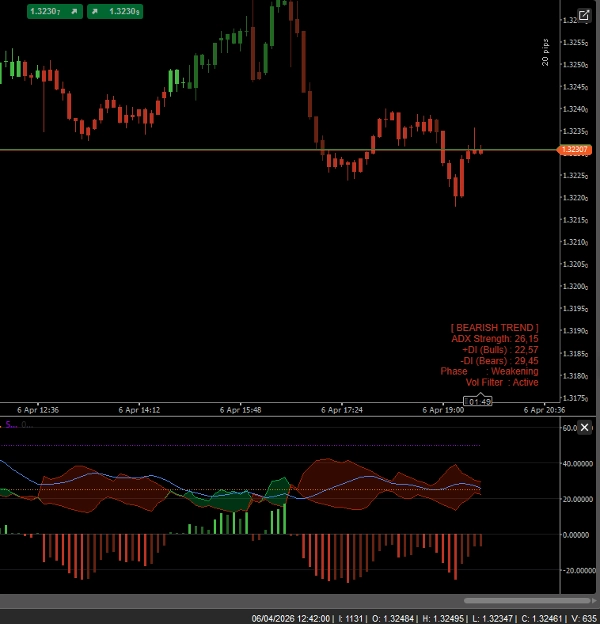
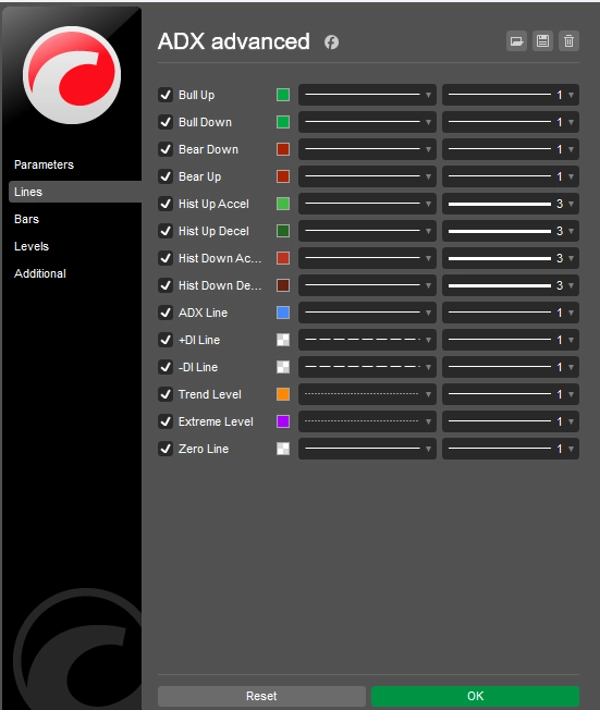
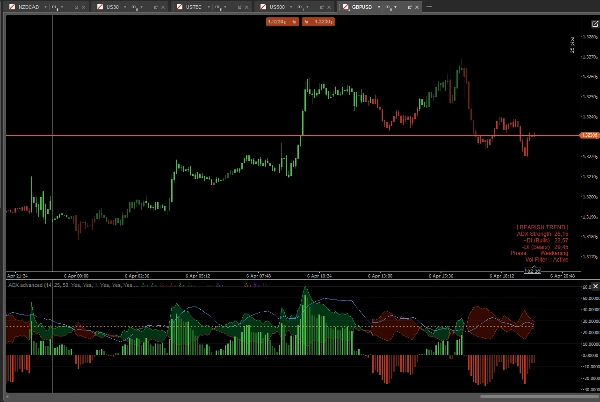
- Nuvole Direzionali (DI Cloud): Invece di linee che si incrociano, lo spazio tra +DI e -DI è riempito da una nuvola colorata dinamica. Nuvola Verde = Tori al comando. Nuvola Rossa = Orsi al comando.
- Istogramma del Momentum: Un istogramma personalizzato nella parte inferiore dell'indicatore misura la distanza esatta tra +DI e -DI. Presenta colori di accelerazione/decelerazione, permettendoti di individuare il momentum che svanisce prima che il trend effettivamente si inverta.
- Colorazione Intelligente delle Barre (Paintbars): L'indicatore colora direttamente le tue candele di prezzo in base alla forza del trend!
-
- Verde/Rosso Chiaro: Trend Forte (ADX > 25 e allineamento +DI/-DI)
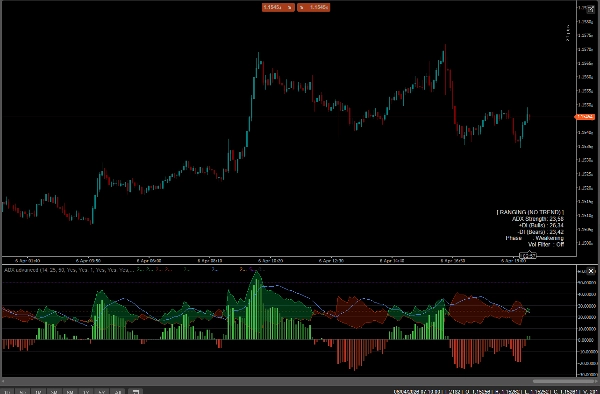
- Verde/Rosso Scuro: Trend Debole / Laterale (ADX < 25)
- Viola/Magenta: Trend Estremamente Sovraesteso (ADX > 50) - Preparati a un ritracciamento!
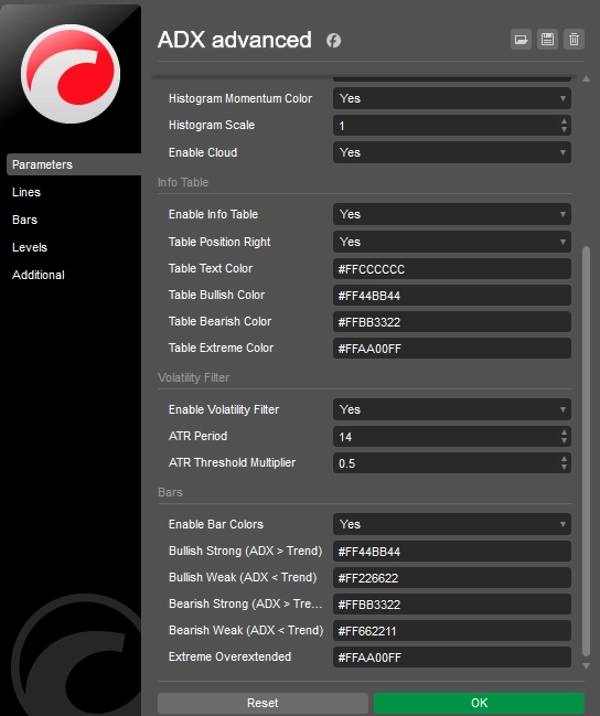
- Pannello Informazioni sul Grafico: Un cruscotto elegante e non invasivo mostra in tempo reale lo Stato Attuale del Mercato (Trend, Laterale, Estremo), la Forza ADX e la Fase del Momentum.
- Filtro di Volatilità Integrato (ATR): Filtro ATR opzionale che rende grigie le candele e le barre dell'istogramma quando il mercato è completamente piatto, evitandoti di operare in fasi di lateralità.
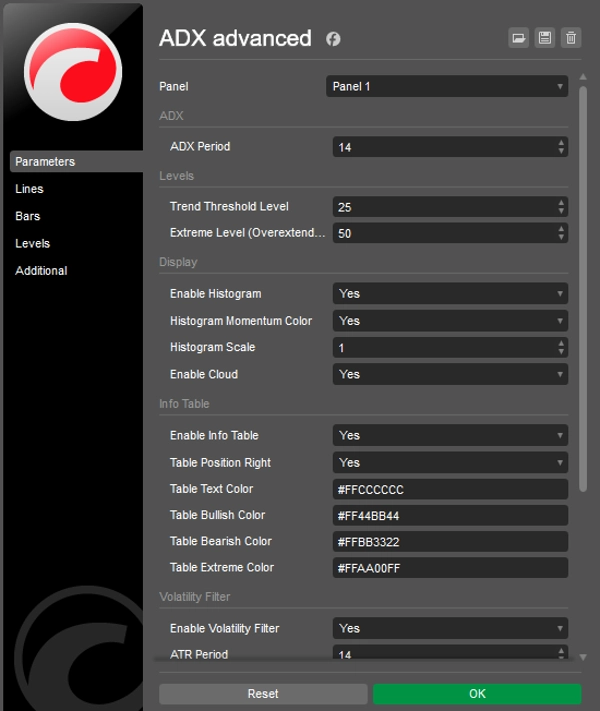
- Completamente Personalizzabile: Cambia colori, soglie (livello Trend 25, livello Estremo 50) e scala dell'istogramma per adattarti al tuo stile di trading personale e al tema del grafico.
Come usarlo?
- Aspetta che la linea blu ADX superi la soglia 25 (il trend è attivo).
- Guarda la Nuvola e l'Istogramma per confermare la direzione (Verde per Long, Rosso per Short).
- Opera i breakout e segui il trend mentre le candele sono colorate con colori "Forti".
- Prendi profitti o sposta gli stop quando la linea ADX supera il livello Estremo 50 (le candele diventano viola).
Riepilogo
Profilo indicatore
Recensioni dei clienti
4.3
Recensioni: 3
5 | 33 % | |
4 | 67 % | |
3 | 0 % | |
2 | 0 % | |
1 | 0 % |
Recensioni dei clienti
April 16, 2026
April 12, 2026
Discussioni
Domande frequenti
BTCUSD
Forex
Signal
Indices
EURUSD
Commodities
GBPUSD
NZDUSD
Prop
XAUUSD
NAS100
ATR
USDJPY
I prodotti disponibili tramite cTrader Store, inclusi bot di trading, indicatori e plugin, sono forniti da sviluppatori terzi e resi disponibili esclusivamente a scopo informativo e di accesso tecnico. cTrader Store non è un broker e non fornisce consulenze in materia di investimento, raccomandazioni individualizzate o garanzie di risultati futuri.


Prezzo
24
Vendite
677
Installazioni gratuite