คำอธิบาย
ข้อมูลตลาดที่วิเคราะห์
London Open Signal โหลดประวัติภายในวันของสัญลักษณ์ที่แนบมาหลายปีโดยตรงจากโบรกเกอร์ของคุณ (ความละเอียด M15 หรือ H1 เลือกได้) และสร้างวันซื้อขายที่ผ่านมาแต่ละวันเป็นสองหน้าต่าง: ช่วง "วัน" เต็มรูปแบบ (ชั่วโมงเริ่มต้น/สิ้นสุดที่กำหนดค่าได้) และเซสชันลอนดอนเอง (ชั่วโมงเปิด/ปิดที่กำหนดค่าได้ ตามเวลาของเซิร์ฟเวอร์โบรกเกอร์) สำหรับแต่ละเซสชันในอดีต มันจำลองการซื้อขายสมมุติสองรายการ — การซื้อและการขาย — โดยใช้จุดหยุดและเป้าหมายที่กำหนดไว้ล่วงหน้า ออกเมื่อเซสชันปิดหากไม่มีการโดนจุดใดจุดหนึ่ง โดยหักลบด้วยค่าคอมมิชชั่นและสเปรด จากนั้นทดสอบห้าความคิดง่ายๆ กับผลลัพธ์เหล่านั้นเพื่อดูว่าอันไหน ถ้ามี อันใดทำนายผลลัพธ์ได้จริง: ช่วงชนะ/แพ้ข้ามคืนปัจจุบัน, วันในสัปดาห์, ตำแหน่งราคาการเปิดเซสชันภายในช่วงของวันก่อนหน้า, ช่องว่างเทียบกับราคาปิดของวันก่อนหน้า และว่าช่วงของวันก่อนหน้ากว้างหรือแคบผิดปกติหรือไม่
วิธีตีความสัญญาณและองค์ประกอบภาพ
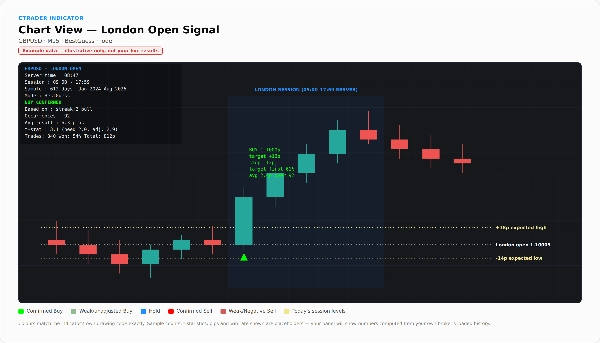
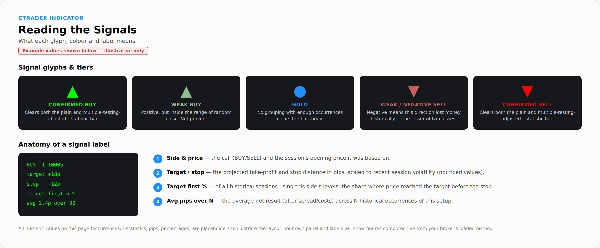
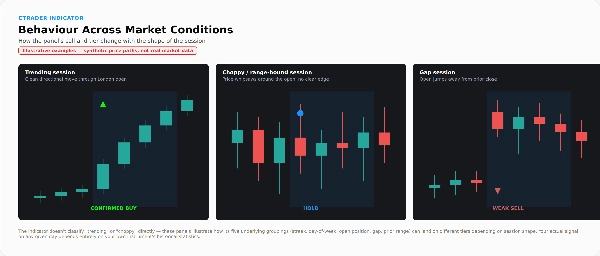
ลูกศรขึ้นสีเขียวหมายถึงสัญญาณซื้อที่เปิดตลาดลอนดอนในวันนั้น; ลูกศรลงสีแดงหมายถึงขาย; จุดสีน้ำเงินหมายถึงถือ (ไม่พบความได้เปรียบที่ชัดเจน) ลูกศรในอดีตเหล่านี้ถูกคำนวณแบบเดินหน้า — แต่ละลูกศรใช้ข้อมูลที่มีอยู่ก่อนวันนั้นเท่านั้น ไม่เคยใช้ผลลัพธ์ของวันนั้นเอง
แผงบนกราฟ (มุมบนซ้าย) แสดงสัญญาณของวันนี้และป้ายชั้น: CONFIRMED, CONFIRMED (unadjusted), WEAK หรือ NEGATIVE บอกคุณว่าควรเชื่อถือสัญญาณลูกศรมากน้อยแค่ไหน — WEAK หมายถึงความได้เปรียบที่เห็นอยู่ในช่วงของเสียงรบกวนแบบสุ่ม และ NEGATIVE หมายถึงทิศทางนั้นเคยทำให้เสียเงินในอดีตและลูกศรเป็นเพียงความเสียหายน้อยกว่าจากสองทางเลือก แผงยังแสดงกลุ่มที่สัญญาณอิงอยู่ จำนวนครั้งที่เกิดขึ้น ผลลัพธ์เฉลี่ย ค่า t-statistic เทียบกับเกณฑ์ธรรมดาและเกณฑ์ที่ปรับสำหรับการทดสอบหลายครั้ง และที่สำคัญที่สุด — คะแนนสะสมแบบเดินหน้าที่แสดงจำนวนการเทรดที่เครื่องมือนี้จะทำจริง อัตราชนะ รวมพิปส์ พิปส์ต่อเทรด และการดรอว์ดาวน์ที่แย่ที่สุด หากคะแนนสะสมนี้แบนหรือเป็นลบ แผงจะแจ้งตรงๆ
สามเลเยอร์เสริมเพิ่มรายละเอียด: ตารางผลลัพธ์เต็มรูปแบบ (ทุกกลุ่มที่ทดสอบ พร้อมขนาดตัวอย่างและค่า t-statistic สำหรับทั้งสองทิศทาง), "ห้องทดลองหยุด/เป้าหมาย" ที่แสดงว่าอัตราชนะเปลี่ยนแปลงอย่างไรเพียงแค่ตำแหน่งที่คุณวางจุดหยุดและเป้าหมาย — เพื่อชี้ให้เห็นว่าอัตราชนะสูงไม่เท่ากับความได้เปรียบจริง — และกล่องระดับเซสชันที่แสดงขนาดทั่วไปของการเคลื่อนไหวขึ้น ลง และช่วงรวมของเซสชันลอนดอนที่เปอร์เซ็นไทล์กลาง/75/90 เส้นประบนเซสชันวันนี้แสดงจุดเปิดและระดับสูง/ต่ำที่คาดหวังซึ่งปรับตามความผันผวน
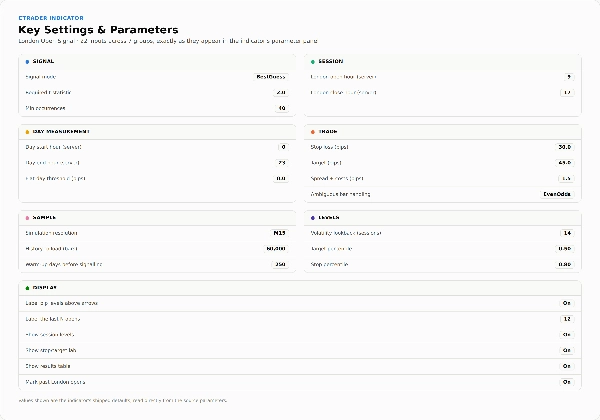
การตั้งค่าและพารามิเตอร์สำคัญ
- สัญญาณ: โหมด (เฉพาะยืนยันเท่านั้น กับ การคาดเดาที่ดีที่สุด), ค่า t-statistic ที่ต้องการ, จำนวนครั้งขั้นต่ำก่อนที่กลุ่มจะนับ
- เซสชัน: ชั่วโมงเปิดลอนดอน, ชั่วโมงปิดลอนดอน (เวลาของเซิร์ฟเวอร์โบรกเกอร์)
- การวัดวัน: ชั่วโมงเริ่มต้น/สิ้นสุดวัน, เกณฑ์วันแบน (พิปส์)
- การเทรด: จุดหยุดขาดทุน (พิปส์), เป้าหมาย (พิปส์), ค่าคอมมิชชั่น/สเปรด (พิปส์), การจัดการแท่งที่คลุมเครือ (มุมมองแย่ / โอกาสเท่าเทียม / มุมมองดี, สำหรับแท่งที่แตะทั้งจุดหยุดและเป้าหมาย)
- ตัวอย่าง: ความละเอียดการจำลอง (H1/M15), ประวัติที่จะโหลด (แท่ง), วันวอร์มอัพก่อนที่เครื่องมือจะเริ่มส่งสัญญาณ
- ระดับ: การมองย้อนความผันผวน (เซสชัน), เปอร์เซ็นไทล์เป้าหมาย, เปอร์เซ็นไทล์หยุด
- การแสดงผล: ป้ายลูกศร / นับป้าย, แสดงระดับเซสชัน, แสดงห้องทดลองหยุด-เป้าหมาย, แสดงตารางผลลัพธ์, ทำเครื่องหมายการเปิดตลาดลอนดอนที่ผ่านมา
กรณีการใช้งานและสถานการณ์การเทรดทั่วไป
ตรวจสอบแผงก่อนเปิดตลาดลอนดอนสำหรับสัญญาณปัจจุบัน ชั้นของมัน และช่วงเซสชันที่คาดหวังสำหรับวันนั้น ศึกษาว่ามีรูปแบบง่ายๆ ที่ตีความได้ซึ่งยังคงมีความหมายทางสถิติสำหรับคู่เงินใดคู่เงินหนึ่งในประวัติของมันหรือไม่ — และดูอย่างตรงไปตรงมาว่ารูปแบบนั้นยังคงอยู่หลังการปรับแก้การทดสอบหลายไอเดียพร้อมกันหรือไม่ ใช้การคาดการณ์ระดับเซสชัน (สูง/ต่ำ ที่คาดหวัง) สำหรับวางแผนเป้าหมายหรือจุดหยุดแยกจากสัญญาณซื้อ/ขายเอง เครื่องมือนี้ไม่ได้ออกแบบมาเพื่อการเทรดอัตโนมัติที่ไม่ต้องดูแล — มันเป็นตัวบ่งชี้ ไม่ใช่ cBot และไม่เคยเปิดการเทรดเอง
เหมาะสำหรับใคร
เทรดเดอร์ที่ต้องการเห็นประวัติการทำงานจริงที่ได้รับการยืนยันแบบเดินหน้าเบื้องหลังสัญญาณ แทนที่จะเชื่อคำกล่าวอ้างโดยไม่มีหลักฐาน และผู้ที่อ่านค่า t-statistic และตัวเลขการดรอว์ดาวน์ควบคู่กับลูกศรได้อย่างสบายใจ เทรดเดอร์ลอนดอนเซสชันแบบเลือกเองที่ให้ความสำคัญกับบริบทช่วงเซสชันแม้จะเลือกละเลยสัญญาณซื้อ/ขาย เครื่องมือนี้ไม่ได้สร้างมาเพื่อคนที่มองหาระบบ "แค่ตามลูกศร" แบบเสียบปลั๊กแล้วเล่น — เครื่องมือจะประเมินสัญญาณของตัวเองและบอกคุณตรงๆ เมื่อเลขไม่สนับสนุนการเทรด
ข้อจำกัดและข้อควรทราบสำคัญ
- ประสิทธิภาพคำนวณแบบสดจากประวัติของโบรกเกอร์ที่โหลดจริงเมื่ออินดิเคเตอร์ทำงาน — ไม่ใช่ไฟล์แบ็คเทสต์ที่สร้างไว้ล่วงหน้า ผลลัพธ์จึงอาจแตกต่างกันไปตามโบรกเกอร์/บัญชี และต้องมีประวัติที่โหลดเพียงพอ (เพิ่ม "ประวัติที่จะโหลด" หากแผงรายงานข้อมูลไม่เพียงพอ)
- การปรับแก้การทดสอบหลายครั้งเป็นวิธีประมาณ ไม่ใช่การรับประกัน — เกณฑ์ที่ปรับลดลงช่วยลดแต่ไม่กำจัดโอกาสที่ผลลัพธ์ดูมีความหมายเพราะโชคช่วย
- ห้าไอเดียที่ทดสอบเป็นตัวจำแนกปัจจัยเดียวง่ายๆ ตรวจสอบแยกกัน ไม่รวมกัน — เป็นการเลือกโดยเจตนาเพื่อให้เครื่องมือเข้าใจง่ายและหลีกเลี่ยงความเสี่ยงการฟิตเกินมากขึ้น
- ในโหมด Best Guess อินดิเคเตอร์จะแสดงทิศทางเสมอ รวมถึงสัญญาณชั้น NEGATIVE — อ่านป้ายชั้นเสมอ ไม่ใช่แค่ลูกศร
- การเติมจุดหยุด/เป้าหมายจำลองใช้สมมติฐานง่ายๆ สำหรับแท่งที่แตะทั้งสองระดับในแท่งเดียวกัน; การดำเนินการจริงอาจแตกต่าง
- อิงเฉพาะราคา/สถิติ — ไม่มีข่าวสาร ปัจจัยพื้นฐาน หรือข้อมูลข้ามสินทรัพย์
- เป็นเพียงภาพและการวิเคราะห์เท่านั้น; ไม่ได้เปิดการเทรด
สรุป
The indicator tests five simple, independent factors—overnight streak, day of the week, opening price position within the previous day’s range, gap size, and previous day’s range width—to identify statistically significant edges. Signals are displayed as arrows on the chart: green for Buy, red for Sell, and blue for Hold, with a tier label (CONFIRMED, WEAK, NEGATIVE) indicating the confidence level based on walk-forward testing.
A panel shows detailed statistics including win rate, total pips, t-statistics, and drawdown, updated live from broker data. Optional overlays provide a full results table, stop/target sensitivity analysis, and session-level range projections. The tool is purely analytical and visual; it does not execute trades and is intended for traders comfortable interpreting statistical metrics alongside signals.













!["[Hamster-Coder] Pivot Points MTF" โลโก้](https://cdn.ctrader.com/image/webp/4c143e5a-309c-40e3-a578-f04d1e133ffa_31159)