present
Kaydolun ve ilk alışverişinizde $50 indirim kazanın
Trading product for Bullet Chart Gösterge Forex Indices, image 1
Bullet Chart
Gösterge
Sürüm 1.0, May 2025
Windows, Mac
4.5
Değerlendirmeler: 2
Trading product for Bullet Chart Gösterge Forex Indices, image 2
Trading product for Bullet Chart Gösterge Forex Indices, image 3
Trading product for Bullet Chart Gösterge Forex Indices, image 4
Başlangıç 28/01/2025
7
Satışlar
397
Ücretsiz yüklemeler

Açıklama


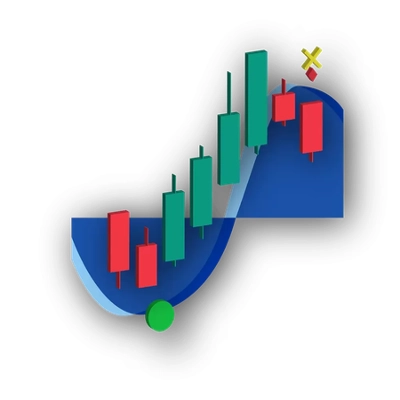
Geleneksel mum çubuklarını, fiyat hareketlerinin netliğini artıran ve tüm önemli piyasa verilerini (Açılış, Yüksek, Düşük, Kapanış) koruyan dikkat çekici piramit şeklindeki mumlarla değiştirin. Trendleri ve dönüşleri analiz etmek için taze, sezgisel bir yol arayan tüccarlar için mükemmel.


Ana Özellikler:

✅ Benzersiz Piramit Tasarımı – Her mum, net bir fiyat yapısı oluşturan iki üçgen (üst ve alt) olarak gösterilir.

✅ Anında Trend Tanıma – Boğa (yeşil) ve ayı (kırmızı) mumlar hızlı analiz için renk kodludur.

✅ Özelleştirilebilir Genişlik – Her zaman diliminde optimal görünürlük için piramit boyutunu (10-200%) ayarlayın.

✅ Fitil Gösterim Seçeneği – Daha temiz veya daha detaylı grafikler için fitilleri (yüksek-düşük aralığı) açıp kapatın.

✅ Tüm Zaman Dilimlerinde Çalışır – M1’den Aylığa kadar, ticaret tarzınıza sorunsuz uyum sağlar.

✅ Net Fiyat Hareketi – Tüm mum çubuğu verilerini yenilikçi bir görsel formatta korur.


Tüccarların Sevme Nedenleri:

🔹 Daha Kolay Desen Tespiti – Üçgen şekiller trendleri ve dönüşleri öne çıkarır.

🔹 Azaltılmış Grafik Karmaşası – Ana bilgileri kaybetmeden fiyat hareketini basitleştirir.

🔹 Tamamen Özelleştirilebilir – Renkleri, genişliği ve fitilleri stratejinize göre kişiselleştirin.

🔹 Tüm Piyasalar İçin Mükemmel – Forex, Hisse Senetleri, Kripto ve Endekslerde çalışır.


Nasıl Çalışır:

Aynı OHLC verilerini koruyarak mum çubuklarını otomatik olarak piramitlerle değiştirir.


Üst üçgen = Gövde üstüne kadar yüksek (boğa/ayı kapanışı).


Alt üçgen = Gövde altına kadar düşük.


İsteğe bağlı fitil tam fiyat aralığını gösterir.


Ticarette Avantaj Sağlayın!

🚀 Benzersiz bir grafik stili ile kalabalıktan sıyrılın.

🚀 Daha net trend görselleştirmesi ile karar verme sürecinizi geliştirin.

🚀 Kendi tarzınıza göre özelleştirin – renkleri ve boyutları tercihinize göre ayarlayın.


İdeal İçin:

✔ Fiyat hareketi tüccarları

✔ Swing tüccarları

✔ Teknik analistler

✔ Geleneksel mum çubuklarından sıkılan herkes!


Özet

YZ özeti
The Bullet Chart indicator replaces traditional candlestick charts with pyramid-shaped candles to enhance price action clarity while retaining all key market data (Open, High, Low, Close). Each candle consists of two triangles: the upper triangle represents the range from the high to the body top (bullish or bearish close), and the lower triangle covers the range from the low to the body bottom. An optional wick can be toggled to display the full price range.

Key features include a unique pyramid design for clear price structure visualization, color-coded bullish (green) and bearish (red) candles for instant trend recognition, and customizable pyramid width (10-200%) to suit different timeframes and preferences. The indicator works seamlessly across all timeframes, from 1-minute to monthly charts, and supports various markets including Forex, Stocks, Crypto, and Indices.

This tool aims to simplify chart analysis by reducing clutter and making trend and reversal patterns easier to detect. It is suitable for price action traders, swing traders, and technical analysts seeking an alternative visual approach to traditional candlesticks. Users can personalize colors, sizing, and wick display to align with their trading strategies.
Gösterge profili

Tartışma

Müşteri değerlendirmeleri

4.5
Değerlendirmeler: 2
5
50 %
4
50 %
3
0 %
2
0 %
1
0 %
Müşteri değerlendirmeleri
June 3, 2025
May 27, 2025

SSS

Forex
Indices
Crypto
Stocks
cTrader Store üzerinden erişilebilen işlem botları, göstergeler ve eklentiler gibi ürünler, üçüncü taraf sağlayıcılar tarafından sağlanır ve yalnızca bilgilendirme ve teknik erişim amaçlarıyla sunulur. cTrader Store bir broker değildir ve yatırım tavsiyesi, kişisel öneriler vermez veya gelecekteki performansı garanti etmez.

Bu oluşturanın diğer ürünleri

Gösterge
Custom your Renko Brick how do you wish!
Gösterge
ATR
RSI
+2
This indicator works best as a trend-confirmation tool—wait for multiple signals!
Gösterge
This is the first version I offer you for free.
Gösterge
Signal
New Trend whit buy-sell signal
Gösterge
Forex
Crypto
+2
Unique Pyramid Design , Clear Price Action Trend
Gösterge
cTreder Smart SMA
Gösterge
Smart Signal Reversal Trend + Patterns
Gösterge
A single color for each session.
Gösterge
The indicator is designed to detect aggressive movements in the market and without volume for trend changes.
Gösterge
1 Candel High Time Freme

Şunları da beğenebilirsiniz

Gösterge
Auto-detect supply & demand zones, remove broken levels, and trade smarter with real-time alerts. Precision made simple.
Gösterge
MACD
Forex
+5
🚀 MACD Pro Trader – Advanced MACD with buy/sell signals, custom MAs & color-coded histograms for smarter trading! 📈🔥
Gösterge
VWAP
Volume
+5
Multi VWAP. Three timeframes. One clean chart. Your Essential Trading Tool.
Gösterge
Prop
Forex
+11
🌊 See when the market is truly in play. Tsunami measures Relative Volume by time-of-day 🌊
Gösterge
AI
ATR
+19
Market Cipher A
Gösterge
Forex
Crypto
Bar Close Alert Manager provides real-time alerts for bar closures with customizable notifications and automation.
Gösterge
EMA
RSI
+2
Advanced TDI indicator with Shark Fin signals, chart arrows, MTF RSI, divergence detection and smart alerts.
Gösterge
Imbalance
Fair Value Gap
+1
Multi-symbol, multi-timeframe Fair Value Gaps in one panel.
Gösterge
VWAP
Volume
+5
The MA Quant Volume Profile Custom Range is a trading indicator that analyzes volume distribution across the price.
Gösterge
Auto Fibonacci Retracement Indicator for cTrader
Gösterge
XAUUSD
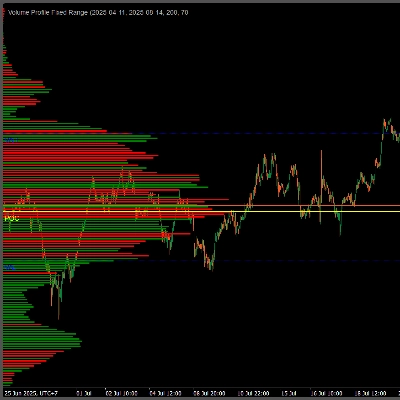
Professional Volume Profile Indicator - Shows volume distribution, POC, Value Areas & Buy/Sell pressure.
Gösterge
Forex
EURUSD
+5
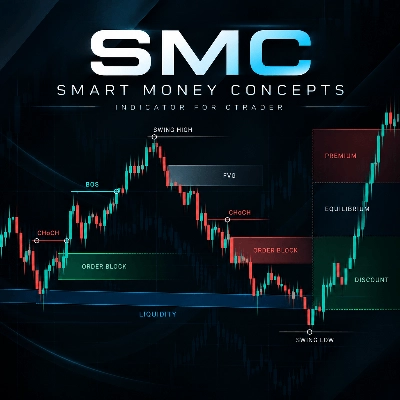
The Smart Money Concepts indicator is an all-in-one overlay tool that automatically detects OB, FVG ecc..
Gösterge
Risk Dashboard
AI-powered daily range forecasts help traders spot volatility opportunities and plan stops and targets.
Gösterge
ATR
Prop
+13
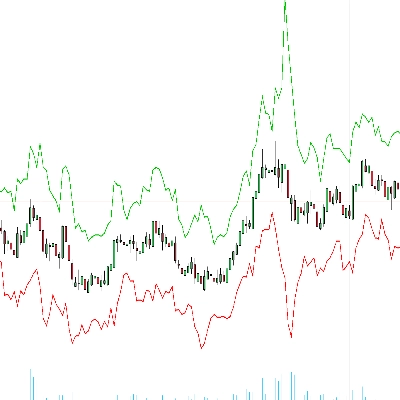
Enhance trading with ATR Bands! Visualize market volatility using dynamic upper and lower ATR bands for precise decision
Gösterge
ATR
BTCUSD
+5
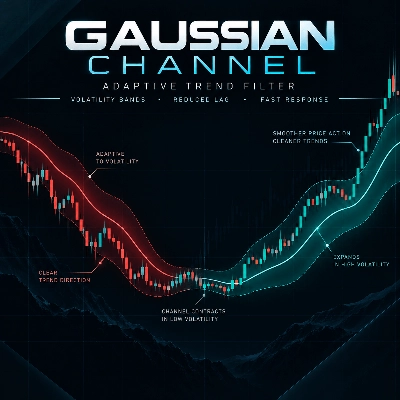
Multi-pole Gaussian filter channel with dynamic color, Reduced Lag & Fast Response modes. Port of DonovanWall's original
Gösterge
Volume
Key Levels
+1
Session volume profiles from tick volume: POC, value area high and low, and naked POCs extended until touched.
Gösterge
Volume
Key Levels
View tick activity across a selected chart range with Point of Control, Value Area High and Value Area Low.
Gösterge
ATR
SMC
+5
Candles Volume Delta is a powerful, visually intuitive indicator that transforms raw tick volume into actionable trading

Fiyat

Başlangıç 28/01/2025
7
Satışlar
397
Ücretsiz yüklemeler