설명
대부분의 추세 지표는 같은 질문에 같은 방식으로 대답합니다: 가격을 부드럽게 하고, 몇 개의 선을 그리며, 교차점을 찾습니다. FDQ 가격 채널은 다른 질문을 중심으로 만들어졌습니다 — 가격이 실제로 무엇을 하고 있는가, 노이즈와 드리프트를 제거한 상태에서, 그리고 그것이 가격이 어디로 갈 가능성이 있는지에 대해 무엇을 알려주는가?
그 결과 세 가지 뚜렷한 분석 레이어를 하나의 읽기 쉬운 오버레이로 결합한 채널 기반 추세 지표가 탄생했습니다.
- 핵심 포인트
다른 출발점. 대부분의 지표가 사용하는 가격 시계열은 통계적으로 문제가 있습니다.
원시 가격은 의미 있는 구조를 가리는 무작위 보행 요소를 포함합니다. 어떤 채널도 그려지기 전에, FDQ는 정량적 연구에서 차용한 기법인 분수 차분 변환을 적용하여 이 드리프트를 제거하면서 데이터의 장기 기억을 의도적으로 보존합니다. 남는 것은 시장이 어디에 있었는지를 반영하지만 현재 위치에 지배당하지 않는 변환된 시계열입니다. 이것이 모든 것의 기초입니다.
- 노이즈에는 비용이 있습니다
모든 지연 기반 평활 방법은 정확성을 위해 타이밍을 희생합니다. 칼만 필터는 그렇지 않습니다.
칼만 필터는 재귀적 추정 과정으로, 시장에 대한 관점을 지속적으로 업데이트하며 새 데이터에 얼마나 신뢰를 둘지와 이미 확립된 정보를 균형 있게 조절합니다. 이동 평균과 달리 고정된 조회 기간이 없으며 과거 모든 바를 동일하게 취급하지 않습니다. 출력은 진정한 움직임에 빠르게 반응하고 노이즈에 반응하는 것을 저항하는 더 깨끗한 가격 표현이며, 평활화가 일반적으로 생성하는 지연 신호가 없습니다.
- 행동에서 만들어진 밴드, 공식에서가 아닙니다
표준 편차 밴드는 가격이 정규 분포한다고 가정합니다. 실제로는 거의 그렇지 않습니다.
FDQ 채널 경계는 조회 기간 동안 변환된 가격의 실제 통계 분포인 분위수 분석을 사용하여 정의됩니다. 상단 밴드는 시리즈가 범위의 상한 극단에서 실제로 도달하는 수준을 표시하며, 하단 밴드는 하한 극단에서 동일하게 표시합니다. 이들은 평균에서 계산된 이론적 경계가 아니라 가격이 실제로 거래된 위치를 반영하여 시장이 특정 시점에 실제로 어떻게 행동하는지에 더 민감합니다.
- 채널 내부의 두 번째 레이어
외부 밴드는 범위를 정의합니다. 내부 밴드는 구역을 정의합니다.
두 번째 밴드 세트는 외부 채널과 중간선 사이에 비례적으로 위치합니다. 이 내부 레이어는 전체 채널보다 좁고 동일한 통계적 기초에 고정된 뚜렷한 거래 구역을 만들어 진입 및 신호 분류를 위한 단계적 참조 역할을 합니다.
- 무엇보다 먼저 추세 상태
맥락 없는 신호는 단지 무작위 데이터일 뿐입니다.
이 지표는 세 밴드 구성 요소 전반에 걸친 다수결 메커니즘을 사용하여 채널의 방향 상태를 지속적으로 추적합니다. 세 개 중 최소 두 개가 같은 방향으로 움직일 때 추세 상태는 상승 또는 하락으로 확인됩니다. 신호는 현재 상태와 일치할 때만 생성됩니다 — 상승 조건에서는 롱 설정만, 하락 조건에서는 숏 설정만. 시장이 이 기준을 충족하지 않으면 상태가 선언되지 않고 신호도 생성되지 않습니다. 상태 간 전환은 차트에 수직선으로 표시됩니다.
- 세 가지 뚜렷한 반등 설정
모든 되돌림이 동일하지는 않습니다. 이 지표는 세 가지 등급을 인식합니다.
추세 상태가 활성화되면, 지표는 특정 반등 패턴을 관찰합니다 — 가격이 추세에 반하여 움직이고, 정의된 수준에 닿았다가 다시 그 수준을 넘어 반전하는 순간들입니다.
-
- 중간 반등 — 가격이 채널 중간선 아래(또는 위)로 떨어졌다가 회복합니다. 추세 내 표준 되돌림입니다.
- 깊은 반등 — 가격이 더 확장되어 내부 밴드 극단에 도달한 후 회복합니다. 더 단호한 되돌림과 더 결정적인 반전입니다.
- 가벼운 반등 — 가격이 추세 쪽 내부 밴드에 닿았다가 반등합니다. 세 가지 중 가장 얕고 가장 자주 발생합니다.
각 유형은 차트에서 시각적으로 구별되며 독립적으로 활성화 또는 비활성화할 수 있습니다.
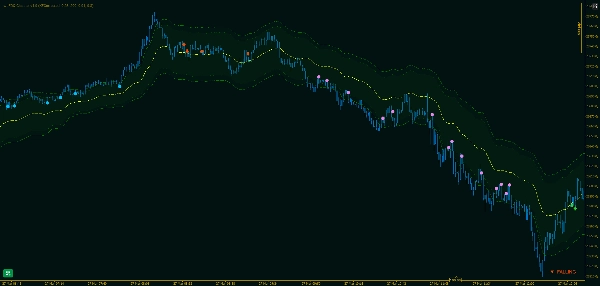
- 당신이 보는 것
차트는 해석 없이 직접 이야기를 전달합니다.
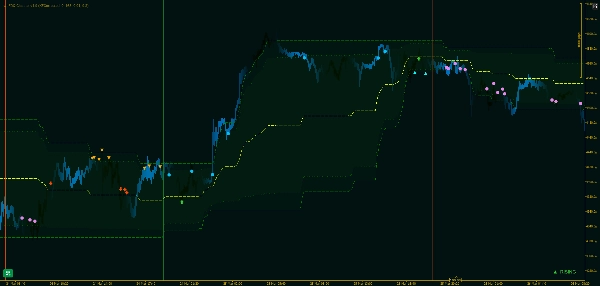
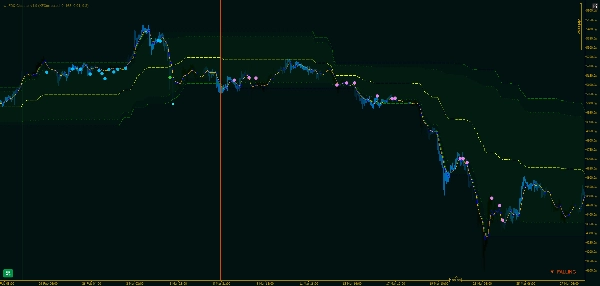
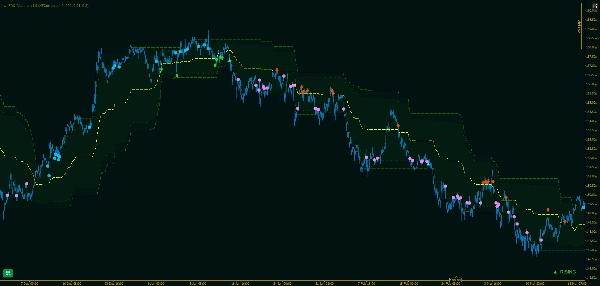
기본 채널, 내부 밴드, 중간선은 연속선으로 가격 위에 오버레이됩니다. 체제 전환은 수직선으로 표시되며 — 상승은 녹색, 하락은 빨간색 — 추세 상태 변화의 역사가 한눈에 보입니다. 신호 마커는 각 반등이 확인된 바에 나타나며, 각 신호 유형과 방향에 대해 별도의 아이콘이 있습니다.
- 이 접근법이 견고한 이유
대부분의 채널 지표는 시장이 빠르게 움직일 때 지연되고, 그렇지 않을 때 과잉 반응합니다.
FDQ 채널은 이동 평균이 아니라 정지 상태이며 기억을 보존하는 변환을 기반으로 구축되었기 때문에 밴드는 가격을 쫓지 않고 실제 행동 분포에 맞게 조정됩니다. 칼만 레이어는 창 기반 평활화에 따른 타이밍 비용 없이 기본 추정을 깨끗하게 유지합니다. 그 결과, 이 채널은 수동 조정 없이도 추세, 횡보, 전환 등 다양한 시장 조건에서 의미를 유지합니다.
요약
The channel boundaries are defined by quantile analysis of the transformed price distribution rather than standard deviation, capturing actual price extremes over the lookback period. It features outer bands marking the full range and inner bands creating a narrower trading zone for refined entry signals. The indicator continuously tracks trend direction using a majority vote across three band components, confirming Rising or Falling states and marking transitions with vertical lines on the chart.
Within active trends, wt.FDQ Channel identifies three distinct rebound setups—Light, Mid, and Deep—each representing different pullback intensities and reversal confirmations. These signals are visually distinct and configurable. The overlay displays the primary channel, inner bands, midline, trend states, and rebound signals directly on the price chart, supporting analysis across various markets including Forex, indices, and cryptocurrencies.
고객 리뷰
5 | 100 % | |
4 | 0 % | |
3 | 0 % | |
2 | 0 % | |
1 | 0 % |


!["[Hamster-Coder] Pivot Points MTF" 로고](https://cdn.ctrader.com/image/webp/4c143e5a-309c-40e3-a578-f04d1e133ffa_31159)
