Deskripsi
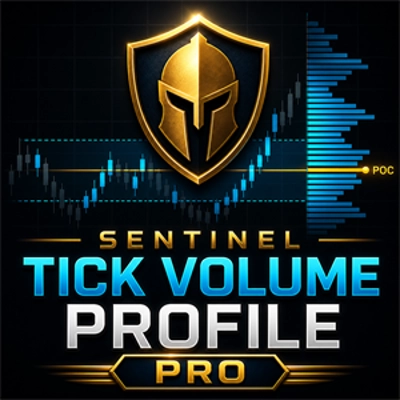
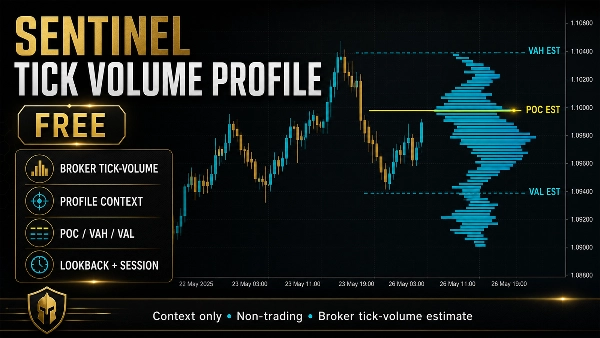
Sentinel Tick Volume Profile Free adalah indikator cTrader non-perdagangan yang mengubah data tick-volume grafik yang tersedia menjadi profil distribusi harga visual. Ini dirancang untuk membantu trader manual memahami di mana aktivitas tick terkonsentrasi dalam rentang grafik yang dipilih.
Indikator bekerja dalam tiga langkah utama:
1. Pilih Rentang Profil
Indikator pertama-tama menentukan bar mana yang harus dimasukkan dalam perhitungan profil.
Ada dua mode rentang:
Lookback Bars
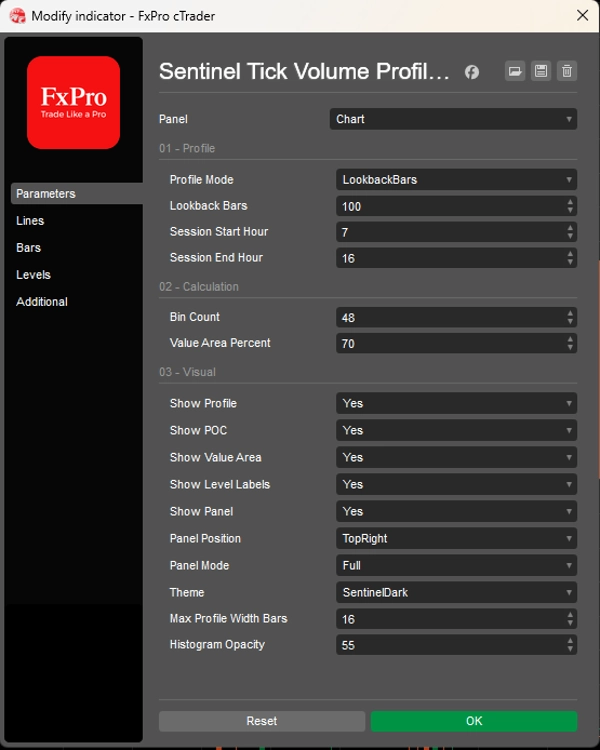
Menggunakan jumlah bar grafik terbaru yang tetap. Misalnya, jika Lookback Bars diatur ke 240, indikator membangun profil dari 240 bar terbaru yang tersedia di grafik.
Current Session
Menggunakan Jam Mulai Sesi dan Jam Akhir Sesi yang dikonfigurasi. Jam sesi diinterpretasikan menggunakan waktu grafik indikator. Indikator dapat menangani sesi aktif, sesi yang selesai, sesi sebelumnya, dan sesi semalam.
Pemilihan rentang ini menentukan area harga dan sampel tick-volume yang digunakan untuk profil.
2. Bangun Profil Tick-Volume
Setelah rentang dipilih, indikator membagi rentang harga dari tertinggi ke terendah yang dipilih menjadi sejumlah bin harga yang dapat dikonfigurasi.
Volume tick broker setiap bar kemudian dialokasikan ke bin yang disentuh oleh rentang tinggi-rendah bar tersebut.
Ini menciptakan distribusi perkiraan tick-volume berdasarkan tingkat harga.
Dari distribusi ini, indikator menghitung:
POC Perkiraan
Bin harga dengan konsentrasi tick-volume broker tertinggi.
VAH Perkiraan
Batas atas dari area nilai perkiraan.
VAL Perkiraan
Batas bawah dari area nilai perkiraan.
Area Nilai Perkiraan
Area di sekitar POC perkiraan yang berisi persentase volume tick total yang dipilih. Pengaturan area-nilai default adalah 70%.
Nilai-nilai ini adalah perkiraan berdasarkan data tick-volume broker. Mereka bukan level volume yang dilaporkan oleh bursa.
3. Tampilkan Profil di Grafik
Indikator kemudian menampilkan profil yang dihitung sebagai konteks visual grafik.
Ini dapat menampilkan:
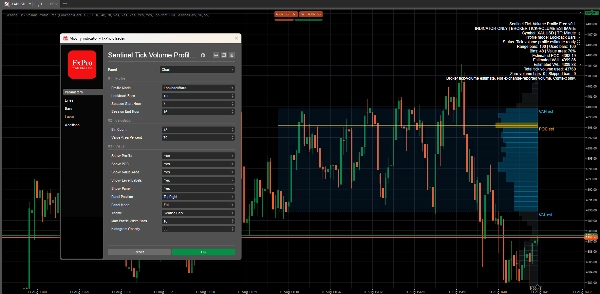
- Histogram profil tick-volume
- Garis POC perkiraan
- Garis VAH perkiraan
- Garis VAL perkiraan
- Pewarnaan area nilai
- Label grafik kompak: POC est, VAH est, dan VAL est
- Ringkasan panel dengan mode profil yang dipilih, detail rentang, jumlah bin, level perkiraan, total volume tick yang digunakan, dan kata-kata pembatasan
Label grafik dapat diaktifkan atau dinonaktifkan. Profil, POC, area nilai, dan panel juga dapat dikontrol secara terpisah.
MODE PANEL
Indikator mencakup tiga mode panel:
Lengkap
Menampilkan informasi paling lengkap, termasuk bar rentang, bar yang digunakan, jumlah bin, persentase area nilai, POC perkiraan, VAH perkiraan, VAL perkiraan, total volume tick yang digunakan, bar volume nol, bar yang dilewati, dan pembatasan tick-volume broker.
Kompak
Menampilkan ringkasan singkat dengan mode, jumlah bin, status, POC perkiraan, dan rentang area nilai.
Minimal
Menampilkan status satu baris yang sangat kompak yang berfokus pada POC perkiraan dan pembatasan konteks saja.
Pembatasan Data Penting
Sentinel Tick Volume Profile Free menggunakan data tick-volume broker dari grafik. Ini tidak menggunakan volume yang dilaporkan oleh bursa, volume futures, data footprint, delta, data tape, atau data aliran pesanan institusional.
Oleh karena itu, profil paling baik dipahami sebagai perkiraan profil tick-volume broker.
Nilai dapat bervariasi tergantung pada broker, simbol, kerangka waktu, sesi, dan riwayat grafik yang tersedia.
Apa yang Tidak Dilakukan Indikator
Sentinel Tick Volume Profile Free tidak melakukan pemesanan, memodifikasi posisi, menutup perdagangan, mengelola perdagangan, atau mengontrol cBot.
Ini tidak memberikan sinyal beli, sinyal jual, konfirmasi masuk, instruksi perdagangan, prediksi pasar, perkiraan tingkat kemenangan, perkiraan kinerja, atau klaim profitabilitas.
Ini hanyalah alat konteks visual manual.
Ringkasan
The indicator divides the high-to-low price range of the selected bars into configurable price bins, allocating tick volume across these bins to estimate volume distribution by price level. It calculates key estimated levels including the Point of Control (POC)—the price bin with the highest tick volume concentration—along with the Value Area High (VAH), Value Area Low (VAL), and the Value Area itself, which by default covers 70% of total tick volume.
The profile is displayed visually on the chart with options to show a histogram, estimated POC, VAH, VAL lines, value-area shading, and compact labels. A panel provides summary information in three modes (Full, Compact, Minimal) detailing profile parameters and volume data. The indicator uses broker tick-volume data only and does not execute trades or provide trading signals. It serves as a manual visual tool to enhance market context understanding.