Nếu bạn đã dành thời gian trên thị trường Forex, bạn sẽ biết việc xác định đồng tiền nào thực sự đang thúc đẩy một biến động là khó khăn như thế nào, đặc biệt khi bạn đang xem nhiều cặp tiền tệ. Tôi thường muốn có một cách rõ ràng hơn để nhìn thấy hiệu suất riêng biệt của các đồng tiền chính, không chỉ là cách một cặp tiền đang hoạt động.
Đó là lý do tôi phát triển chỉ báo Sức Mạnh Tương Đối của Tiền Tệ này.
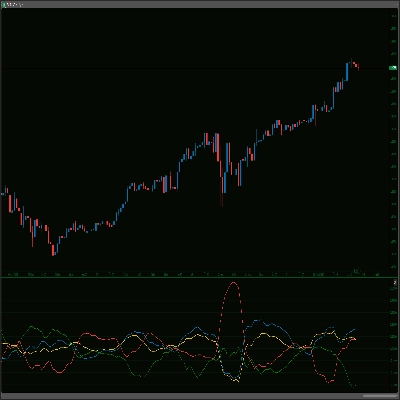
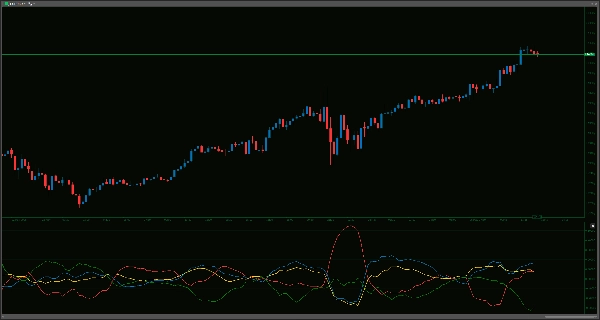
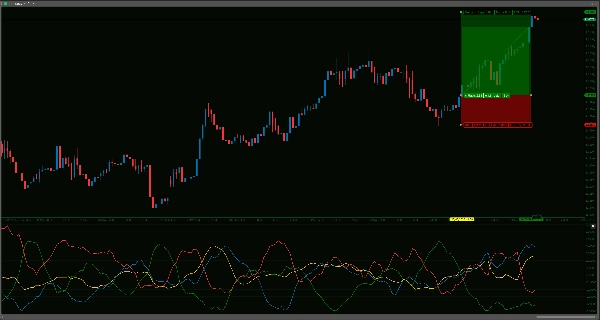
Ý tưởng khá đơn giản: nó nhằm đo lường và hiển thị sức mạnh tương đối của AUD, USD, EUR và JPY. Nó làm điều này bằng cách xem xét cách mỗi đồng tiền này hoạt động so với một rổ các đồng tiền khác (cụ thể qua các cặp như AUDUSD, AUDEUR, AUDJPY, EURUSD, EURJPY và USDJPY) trong một khoảng thời gian nhìn lại mà bạn có thể định nghĩa.
Cách tôi thấy nó hữu ích, và cách nó có thể giúp bạn:
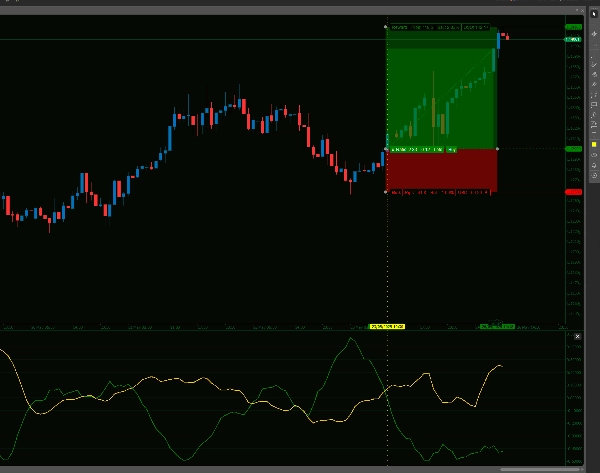
- Lựa chọn cặp tốt hơn: Đôi khi, việc thấy rằng, ví dụ, AUD liên tục mạnh lên trong khi JPY yếu đi có thể thúc đẩy bạn xem xét kỹ hơn cặp AUD/JPY. Nó có thể giúp lọc ra các cặp bạn tập trung vào.
- Hiểu các yếu tố thúc đẩy thị trường: Khi một cặp như EUR/USD di chuyển, đó chủ yếu là do sức mạnh của USD hay sự yếu đi của EUR? Chỉ báo này có thể cho bạn một góc nhìn về điều đó, giúp bạn hiểu dòng chảy rộng hơn.
- Tùy chỉnh theo phong cách của bạn:
-
- Bạn có thể điều chỉnh
LookbackPeriod(mặc định là 14 thanh). Khoảng thời gian ngắn hơn sẽ phản ứng nhanh hơn, khoảng thời gian dài hơn sẽ hiển thị các xu hướng đã được thiết lập. - Cũng có một
SmoothingPeriod(mặc định là 5 thanh) áp dụng EMA cho các đường sức mạnh. Điều này có thể giúp giảm bớt một số nhiễu nếu bạn thích kết quả mượt mà hơn. Nếu bạn muốn phép tính thô, chỉ cần đặt smoothing thành 0.
- Bạn có thể điều chỉnh
- Hình ảnh rõ ràng: Nó vẽ sức mạnh của từng đồng tiền như một đường riêng biệt trong cửa sổ riêng dưới biểu đồ chính của bạn, vì vậy nó không làm rối hành động giá của bạn.
- Dữ liệu đáng tin cậy: Các phép tính được thực hiện trên giá đóng cửa của mỗi thanh, vì vậy các đường sẽ không vẽ lại hoặc thay đổi khi một thanh đã hoàn thành.
Không có chỉ báo nào là quả cầu pha lê, và chỉ báo này cũng không khác. Nó là một công cụ. Tôi thấy nó là một phần hữu ích trong quá trình phân tích của mình, đặc biệt để xác nhận ý tưởng hoặc có cái nhìn nhanh về những gì các đồng tiền chính đang làm.
Lưu ý, vì chỉ báo này lấy dữ liệu cho tất cả các cặp tiền tệ để tính toán chính xác sức mạnh tương đối thực sự, chỉ báo này có thể tiêu tốn nhiều tài nguyên và đôi khi làm Ctrader bị treo nếu bạn cũng có các chỉ báo nặng tài nguyên khác. Tôi đã gặp trường hợp này một lần trong tháng qua trên máy tính 5 năm tuổi của mình nên nó không xảy ra thường xuyên. Nhưng nếu có, chỉ cần làm mới khung thời gian cửa sổ hoặc điều chỉnh đơn giản các thiết lập khoảng thời gian +/-1 sẽ buộc tính toán lại và chỉ báo sẽ xuất hiện lại.
--------------------------
Xin vui lòng xem qua các chỉ báo khác của tôi!
https://ctrader.com/products/1181
https://ctrader.com/products/1182
https://ctrader.com/products/1180
https://ctrader.com/products/1015
https://ctrader.com/products/555
https://ctrader.com/products/553
https://ctrader.com/products/554
https://ctrader.com/products/552
https://ctrader.com/products/557
https://ctrader.com/products/845
https://ctrader.com/products/848
https://ctrader.com/products/847
https://ctrader.com/products/846
https://ctrader.com/products/551
https://ctrader.com/products/574
https://ctrader.com/products/573
https://ctrader.com/products/556
https://ctrader.com/products/558
5 | 67 % | |
4 | 33 % | |
3 | 0 % | |
2 | 0 % | |
1 | 0 % |


