Description
📊 Jackson Zones — Cartographie adaptative des zones de Fibonacci
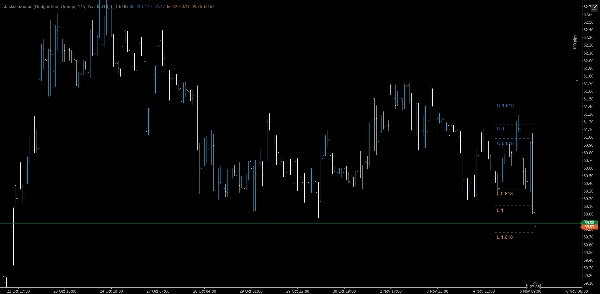
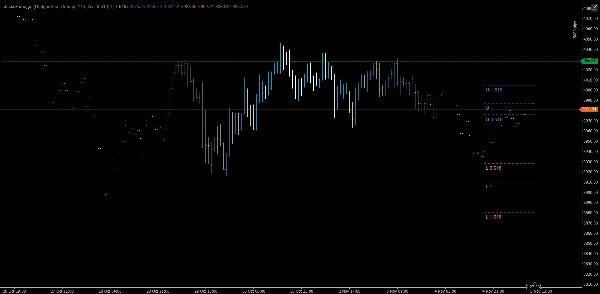
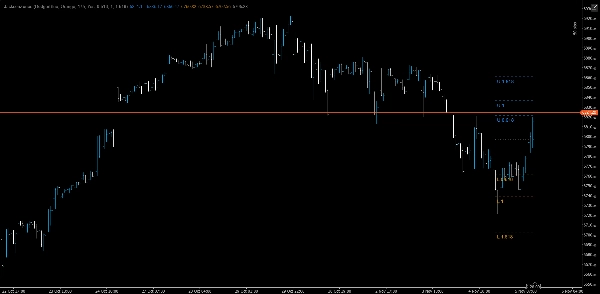
Révélez le rythme sous-jacent à l'action des prix. Jackson Zones cartographie la structure intrajournalière et pluri-quotidienne en utilisant des plages de session projetées par Fibonacci, un étiquetage adaptatif et une logique temporelle robuste. Conçu pour une clarté de niveau institutionnel, c’est votre avantage sur les marchés volatils.
🔍 Fonctionnalités clés
- Multiplicateurs de Fibonacci personnalisables
Définissez vos propres ratios d'expansion (par défaut : 0,618, 1,000, 1,618) pour adapter les zones à votre stratégie.
- Mode pluri-quotidien : activez pour étendre les zones sur plusieurs sessions, révélant une structure persistante et une confluence à long terme.
- Logique du week-end
Utilise automatiquement les données du vendredi pour les sessions de dimanche et lundi, garantissant des niveaux fiables même chez les courtiers proposant des barres du dimanche.
- Flexibilité visuelle
- Couleurs ajustables des zones supérieure/inférieure
- Contrôle de l'opacité (0–255) pour des superpositions transparentes
- Étiquettes optionnelles reflétant dynamiquement vos multiplicateurs choisis
- Conception de la superposition
Les zones et pivots sont tracés directement sur le graphique des prix pour un contexte immédiat.
🧠 Cas d'utilisation
• Confirmation de cassure : des mouvements forts à travers les zones 1,000 ou 1,618 signalent souvent une continuation.
• Détection de retournement : les échecs aux zones 0,618 ou 1,000 indiquent une exhaustion.
• Gestion des trades : utilisez les zones pour le placement des stops, le scaling ou les objectifs de profit.
• Ancrage de session : les zones se réinitialisent quotidiennement, s'adaptant à la volatilité évolutive tout en respectant les écarts du week-end.
Résumé
Avis clients
5 | 0 % | |
4 | 100 % | |
3 | 0 % | |
2 | 0 % | |
1 | 0 % |


