

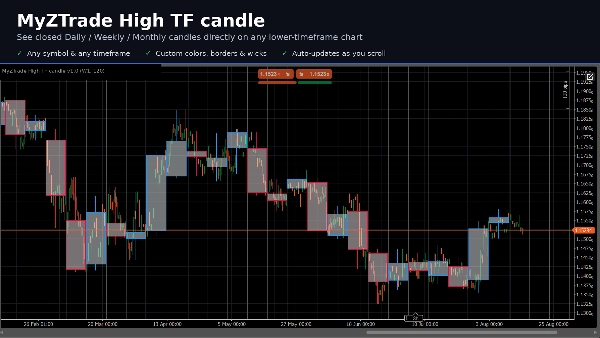
说明
MyZTrade 高时间框架蜡烛图是一种多时间框架可视化工具,可将已完成的高时间框架蜡烛图(日线、周线或月线——可选择)直接叠加在您当前的图表上,以带有实体、边框和高低影线的彩色方框形式显示,类似于在不切换图表的情况下查看 D1 或 W1 蜡烛图。
仅绘制已收盘的高时间框架蜡烛图。正在形成的蜡烛图会被有意跳过,因此在其周期仍未结束时,方框形状不会改变——它只会在周期完全收盘后出现。
指标类型:多时间框架叠加 / 价格行为上下文工具。适用于任何品种和任何较低时间框架(例如 M15、H1、H4)。
主要特点:
- 高时间框架可选择:日线、周线或月线
- 可配置可见方框数量,确保在长时间历史数据下图表加载保持可控
- 多头和空头蜡烛图分别使用不同的填充色和边框色
- 每个方框可选显示高低影线
- 滚动图表时自动重绘
交易使用场景:在较低时间框架执行交易时,读取高时间框架的支撑/阻力区域及日线或周线偏向,并研究价格在已完成的高时间框架区间内的表现,无需来回切换图表。
摘要
AI summary
MyZTrade High TF candle is a multi-timeframe visualization indicator designed to overlay completed higher-timeframe candles—Daily, Weekly, or Monthly—directly onto a lower timeframe chart (e.g., M15, H1, H4). It displays these higher timeframe candles as colored boxes with distinct bodies, borders, and optional high/low wicks, providing a clear view of higher timeframe price action without switching charts. Only fully closed higher timeframe candles are shown, ensuring that the displayed boxes remain static and do not change shape during the current period. Users can configure the number of visible boxes to manage chart load and customize separate fill and border colors for bullish and bearish candles. The indicator automatically redraws when scrolling the chart. This tool aids traders in identifying higher timeframe support and resistance zones and assessing daily or weekly market bias while executing trades on lower timeframes. It supports any symbol and serves as a price-action context tool for enhanced multi-timeframe analysis.
指标配置
客户评价
0.0
评价:0
客户评价
该产品尚无评价。已经试过了?抢先告诉其他人!
讨论
常见问答
Inside Bar
Engulfing
Fair Value Gap
BOS
Imbalance
CHOCH
Support & Resistance
cTrader Store 提供的所有产品,包括交易机器人、指标和插件,均由第三方开发者提供,仅供信息参考和技术访问之用。cTrader Store 并非经纪商,不提供投资建议、个人推荐或任何未来业绩保证。
该作者的其他作品








!["[Hamster-Coder] Moving Average MTF" 标识](https://cdn.ctrader.com/image/webp/b11b98b1-194d-4b8e-b00e-d611826ad159_31226)











价格

注册日期 28/06/2025