説明
ほとんどのトレンド指標は同じ質問に同じ方法で答えます:価格を平滑化し、いくつかの線を引き、クロスオーバーを探します。FDQプライスチャネルは異なる質問に基づいて構築されました — 価格は実際に何をしているのか、ノイズやドリフトを取り除き、それがどこに向かう可能性が高いかを教えてくれます。
その結果、3つの異なる分析層を1つの読みやすいオーバーレイに組み合わせたチャネルベースのトレンド指標が生まれました。
- 重要なポイント
異なる出発点。ほとんどの指標が使用する価格系列は、統計的に問題があります。
生の価格は意味のある構造を隠すランダムウォーク成分を含んでいます。チャネルを描く前に、FDQは分数微分変換を適用します — これは定量的研究から借用した技術で、このドリフトを除去しつつ、データの長期記憶を意図的に保持します。残るのは、市場がどこにあったかを反映しつつ、現在の位置に支配されなくなった変換された系列です。これがすべての基盤となります。
- ノイズにはコストがある
すべての遅延ベースの平滑化手法はタイミングを精度と交換します。カルマンフィルターはそうではありません。
カルマンフィルターは再帰的推定プロセスで、市場の見方を継続的に更新し、新しいデータをどれだけ信頼するかと既に確立されたものとのバランスを取ります。移動平均とは異なり、固定された遡及期間がなく、過去のすべてのバーを同等に扱いません。出力は価格のよりクリーンな表現であり、本物の動きに迅速に反応し、ノイズに反応するのを抑えます — 通常の平滑化が生む遅延信号なしに。
- 行動に基づくバンド、公式ではない
標準偏差バンドは価格が正規分布していると仮定しますが、ほとんどそうではありません。
FDQチャネルの境界は、遡及期間の変換価格の実際の統計分布である分位点分析を用いて定義されます。高バンドは系列が範囲の上限で実際に達するレベルを示し、低バンドは下限で同様に示します。これらは平均から計算された理論的境界ではなく、価格が実際に取引された場所を反映しており、市場が任意の時点で真にどのように振る舞っているかにより敏感です。
- チャネル内の第二層
外側のバンドは範囲を定義し、内側のバンドはゾーンを定義します。
第二のバンドセットは外側チャネルとその中間線の間に比例的に位置します。この内層は、全チャネルより狭く、同じ統計的基盤に基づいた明確な取引ゾーンを作り、エントリーやシグナル分類の段階的な基準として機能します。
- すべての前にあるトレンド状態
コンテキストのないシグナルは単なるランダムなデータです。
指標はチャネルの方向状態を継続的に追跡し、3つのバンド成分の多数決メカニズムを使用します。3つのうち少なくとも2つが同じ方向に動いている場合、トレンド状態は上昇または下降として確認されます。シグナルは現在の状態と一致する場合にのみ生成されます — 上昇状態ではロングセットアップのみ、下降状態ではショートセットアップのみ。市場がこの閾値を満たさない場合、状態は宣言されず、シグナルも生成されません。状態間の遷移はチャート上に垂直線として直接マークされます。
- 3つの異なるリバウンドセットアップ
すべてのプルバックが同じではありません。指標は3つの段階を認識します。
トレンド状態がアクティブになると、指標は特定のリバウンドパターンを監視します — 価格がトレンドに逆らって動き、定義されたレベルに触れてからそれを越えて反転する瞬間です。
-
- ミッドリバウンド — 価格がチャネルの中間線を下回る(または上回る)ものの回復する。トレンド内の標準的なプルバック。
- ディープリバウンド — 価格がさらに伸びて内側バンドの極端な位置に達し、その後回復する。より強いプルバックでより決定的な反転。
- ライトリバウンド — 価格がトレンド側の内側バンドに触れてすぐに戻る。3つの中で最も浅く、最も頻繁に発生します。
各タイプはチャート上で視覚的に区別でき、独立して有効化または無効化できます。
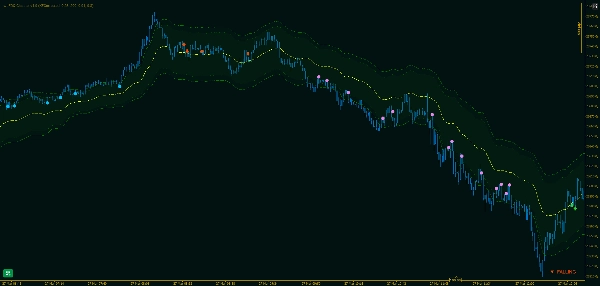
- 見えるもの
チャートは解釈なしに直接物語を伝えます。
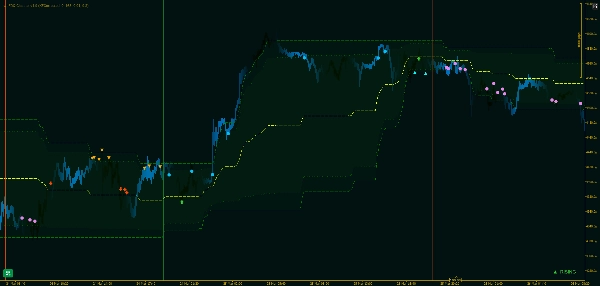
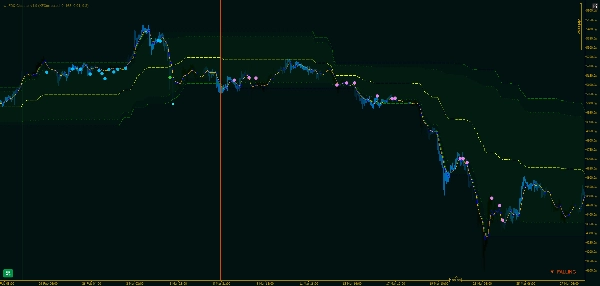
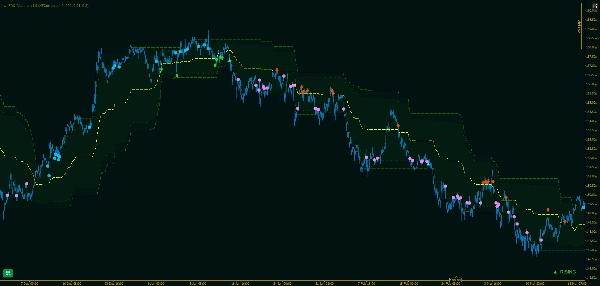
主要チャネル、内側バンド、中間線は価格に連続線としてオーバーレイされます。レジームの遷移は垂直線でマークされ — 上昇は緑、下降は赤 — トレンド状態の変化の履歴が一目でわかります。シグナルマーカーは各リバウンドが確認されたバーに表示され、シグナルの種類と方向ごとに別々のアイコンがあります。
- このアプローチが有効な理由
ほとんどのチャネル指標は市場が速く動くと遅れ、市場が動かないと過剰反応します。
FDQチャネルはローリング平均ではなく、定常的で記憶を保持する変換に基づいて構築されているため、バンドは価格を追いかけるのではなく実際の行動の分布に適応します。カルマン層は基礎となる推定をクリーンに保ち、ウィンドウ平滑化に伴うタイミングコストを導入しません。その結果、トレンド、レンジ、移行期など異なる市場状況でも意味を持ち続けるチャネルが得られ、手動調整を必要としません。
概要
The channel boundaries are defined by quantile analysis of the transformed price distribution rather than standard deviation, capturing actual price extremes over the lookback period. It features outer bands marking the full range and inner bands creating a narrower trading zone for refined entry signals. The indicator continuously tracks trend direction using a majority vote across three band components, confirming Rising or Falling states and marking transitions with vertical lines on the chart.
Within active trends, wt.FDQ Channel identifies three distinct rebound setups—Light, Mid, and Deep—each representing different pullback intensities and reversal confirmations. These signals are visually distinct and configurable. The overlay displays the primary channel, inner bands, midline, trend states, and rebound signals directly on the price chart, supporting analysis across various markets including Forex, indices, and cryptocurrencies.
カスタマーレビュー
5 | 100 % | |
4 | 0 % | |
3 | 0 % | |
2 | 0 % | |
1 | 0 % |


