
Mô tả
LTtradingBox là gì?
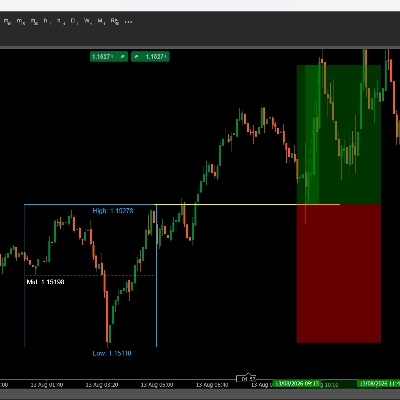
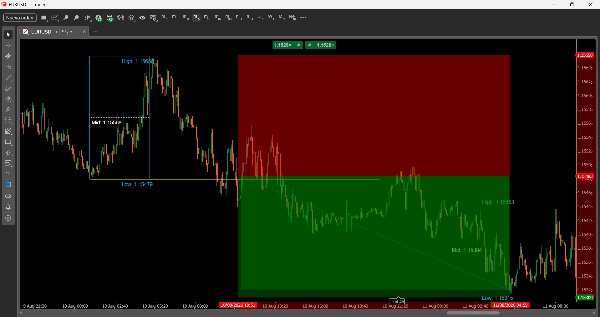
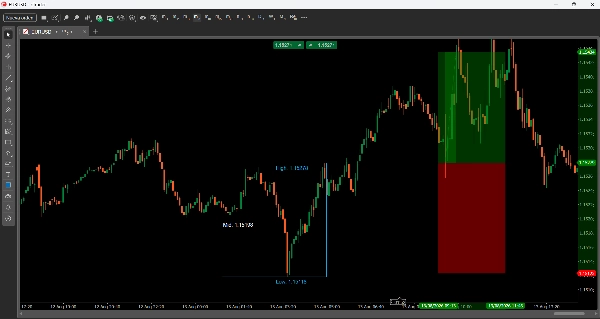
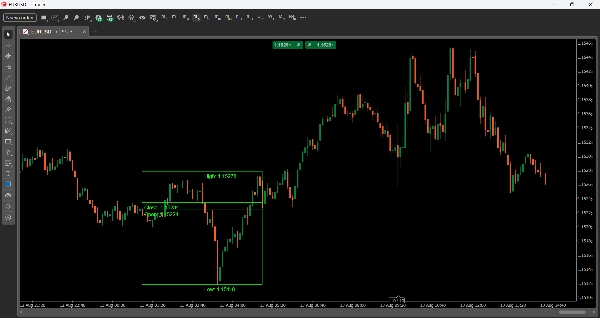
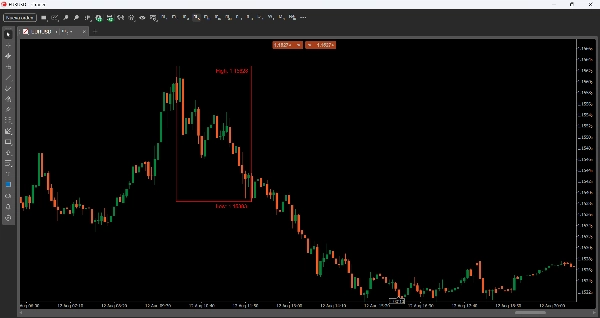
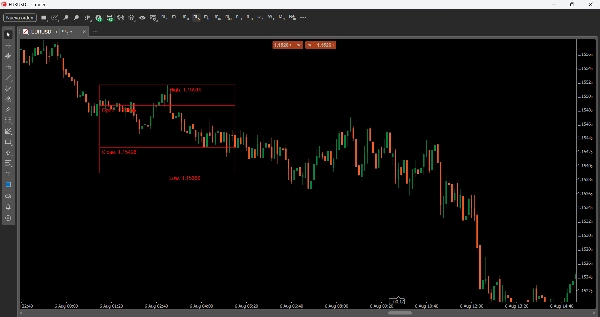
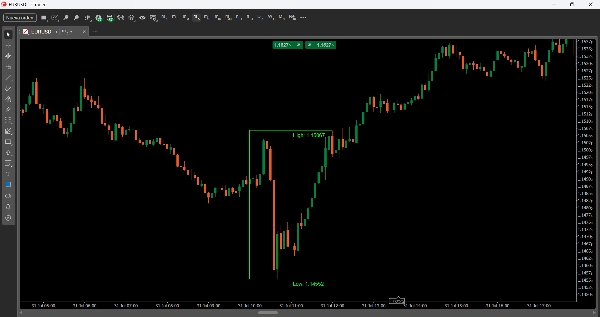
LTtradingBox đánh dấu trực quan phạm vi giá (cao, thấp, mở và đóng) của một cửa sổ thời gian bạn định nghĩa — ví dụ như phiên London hoặc New York. Hộp tự động thay đổi màu sắc dựa trên kết quả của phiên đó: xanh lá nếu đóng cửa tăng giá, đỏ nếu đóng cửa giảm giá, xám nếu trung tính (hoặc bất kỳ màu nào bạn chọn cho từng trường hợp). Nó cũng thêm các đường tham chiếu (Giá giữa, Thời gian giữa) và một lớp tô tùy chọn, giúp bạn dễ dàng nhận biết các vùng thanh khoản, phạm vi tích lũy và các mức quan trọng để giao dịch ngay lập tức.
Các tham số
Cài đặt thời gian
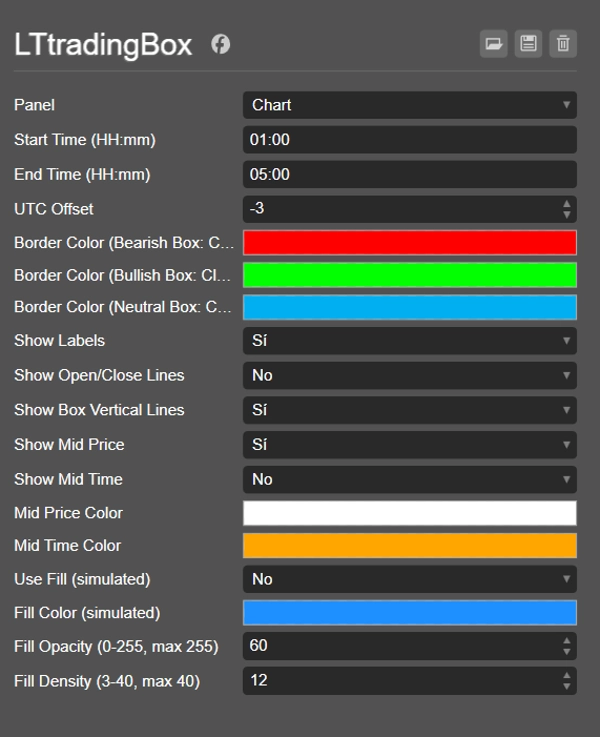
- Thời gian bắt đầu (HH:mm) — Thời gian bắt đầu của hộp (định dạng 24 giờ).
- Thời gian kết thúc (HH:mm) — Thời gian kết thúc của hộp.
- Độ lệch UTC — Điều chỉnh thời gian để hộp phù hợp với giờ địa phương của bạn hoặc phiên bạn muốn theo dõi (ví dụ London, NY, Châu Á), bất kể múi giờ của nhà môi giới.
Màu sắc
- Màu viền (Hộp giảm giá: Đóng < Mở) — Màu viền khi hộp đóng cửa giảm giá.
- Màu viền (Hộp tăng giá: Đóng > Mở) — Màu viền khi hộp đóng cửa tăng giá.
- Màu viền (Hộp trung tính: Đóng == Mở) — Màu viền khi giá đóng bằng giá mở.
Tùy chọn hiển thị
- Hiển thị nhãn — Bật/tắt các nhãn văn bản hiển thị giá Cao, Thấp, Mở và Đóng.
- Hiển thị đường Mở/Đóng — Vẽ các đường ngang đánh dấu giá mở và đóng trong hộp.
- Hiển thị đường thẳng đứng của hộp — Bật hình chữ nhật đầy đủ (4 viền); nếu tắt, chỉ hiển thị các đường Cao và Thấp.
- Hiển thị Giá giữa — Vẽ một đường chấm tại điểm giữa giữa Cao và Thấp.
- Hiển thị Thời gian giữa — Vẽ một đường thẳng đứng tại điểm giữa thời gian của hộp.
- Màu Giá giữa / Màu Thời gian giữa — Màu tùy chỉnh cho các đường đó.
Tô màu (tô màu trực quan)
- Sử dụng tô màu (giả lập) — Bật tô màu giả lập bên trong hộp (sử dụng các đường mỏng chồng lên nhau).
- Màu tô (giả lập) — Màu tô.
- Độ mờ tô (0-255, tối đa 255) — Mức độ trong suốt của lớp tô.
- Mật độ tô (3-40, tối đa 40) — Số lượng đường dùng để giả lập lớp tô (mật độ cao hơn = tô đặc hơn).
Ý tưởng giao dịch
- Phá vỡ và kiểm tra lại: chờ giá phá vỡ mức Cao hoặc Thấp của hộp, sau đó quay lại kiểm tra lại mức đó như hỗ trợ/kháng cự trước khi vào lệnh theo hướng phá vỡ.
- Đảo chiều tại các cực: nếu giá chạm mức Cao hoặc Thấp của hộp mà không phá vỡ mạnh mẽ, có thể báo hiệu sự từ chối và di chuyển về phía bên kia của hộp.
- Định hướng theo phiên: màu sắc của hộp cung cấp cho bạn một định hướng nhanh (tăng/giảm/trung tính) về cách phiên đó di chuyển, hữu ích để căn chỉnh các lệnh vào trong các phiên sau.
- Giá giữa như nam châm: điểm giữa thường hoạt động như một vùng cân bằng lại — tìm các điểm vào lệnh khi giá quay trở lại Giá giữa sau một đợt di chuyển mạnh mẽ.
- So sánh các hộp liên tiếp: vì mỗi hộp hàng ngày được lưu lại (qua thẻ ngày), bạn có thể so sánh phạm vi và định hướng của nhiều phiên liên tiếp để phát hiện xu hướng ngắn hạn.
Tóm tắt
Tóm tắt AI
LTtradingBox is a customizable trading indicator that visually highlights the price range—high, low, open, and close—within any user-defined time window, such as a specific trading session. The indicator draws a colored box representing this range, automatically changing its border color to green for bullish closes, red for bearish closes, or gray for neutral, with customizable color options. It includes reference lines for the midpoint price and midpoint time, which can be displayed as dotted or vertical lines, aiding in identifying liquidity zones, accumulation areas, and key support/resistance levels.
Users can configure start and end times, apply a UTC offset to align with local or session times, and toggle display options such as labels for price points, open/close lines, full box borders, and visual fills with adjustable color, opacity, and density. The indicator supports trading strategies including breakout and retest of box boundaries, reversal signals at extremes, session-based directional bias, and using the midpoint as a rebalancing zone. It also allows comparison of consecutive session boxes to detect short-term trends. LTtradingBox is designed to assist traders in quickly identifying key levels and market structure within chosen timeframes.
Users can configure start and end times, apply a UTC offset to align with local or session times, and toggle display options such as labels for price points, open/close lines, full box borders, and visual fills with adjustable color, opacity, and density. The indicator supports trading strategies including breakout and retest of box boundaries, reversal signals at extremes, session-based directional bias, and using the midpoint as a rebalancing zone. It also allows comparison of consecutive session boxes to detect short-term trends. LTtradingBox is designed to assist traders in quickly identifying key levels and market structure within chosen timeframes.
Hồ sơ chỉ báo
Danh mục chỉ báo
Hỗ trợ & kháng cự
Loại đầu ra
Hình ảnh trực quan
Yêu cầu dữ liệu
Chỉ dữ liệu nến
Tín hiệu được hỗ trợ
Phá vỡ giá
Đảo chiều
Phá ngưỡng
Chạm ngưỡng
Đánh giá của khách hàng
0.0
Đánh giá: 0
Đánh giá của khách hàng
Sản phẩm này chưa có đánh giá nào. Bạn đã dùng thử chưa? Hãy là người đầu tiên chia sẻ với mọi người!
Thảo luận
Câu hỏi thường gặp
Key Levels
Support & Resistance
Các sản phẩm có sẵn trên cTrader Store, bao gồm bot giao dịch, chỉ báo và plugin, được cung cấp bởi các nhà phát triển bên thứ ba và chỉ nhằm mục đích cung cấp thông tin và tiếp cận kỹ thuật. cTrader Store không phải là nhà môi giới và không cung cấp lời khuyên đầu tư, khuyến nghị cá nhân hay bất kỳ đảm bảo nào về hiệu suất trong tương lai.


















Giá
Kể từ 10/01/2025