
Description
MarketSessions – Votre avantage de trading, visualisé
Transformez le temps du marché en puissance de trading
MarketSessions est un indicateur cTrader de qualité professionnelle qui donne vie aux sessions de marché mondiales — pour que vous puissiez trader là où l'élan est réel et où le timing devient votre avantage.
🚀 Pourquoi les traders font confiance à MarketSessions
Voyez le rythme du marché
Visualisez instantanément Londres, New York, Tokyo, Sydney – et toute autre session que vous souhaitez – avec des superpositions propres et élégantes qui s’adaptent à votre graphique.
Tradez plus intelligemment, pas plus tard
Recevez des notifications en temps réel lorsque les sessions s’ouvrent, se ferment ou atteignent des niveaux clés – livrées via Telegram ou Discord (à votre choix).
Attaquez les zones à haute probabilité
Profitez des outils intégrés tels que le Breakout de la plage d’ouverture, le Point de Contrôle (POC) et les lignes de session précises pour ne jamais manquer une cassure ou un rejet.
🎯 Fonctionnalités clés
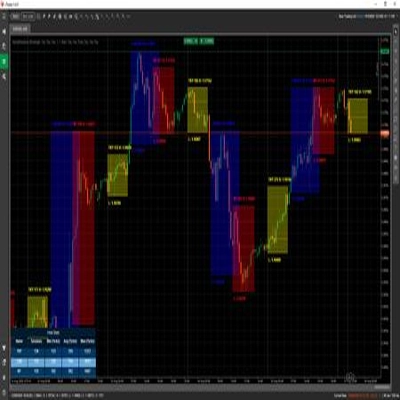
- Visualisation et gestion des sessions – horaires, couleurs et étiquettes entièrement personnalisables, même pour les marchés qui se chevauchent
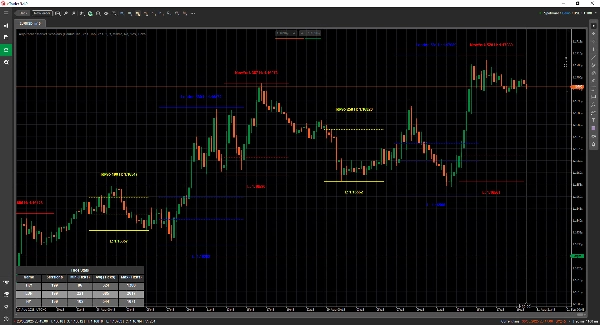
- Outils de dessin avancés – comprend les traceurs Double ❘❘ et Ligne médiane, rectangles de breakout, marqueurs de texte et un mode double ligne pour les traders minimalistes
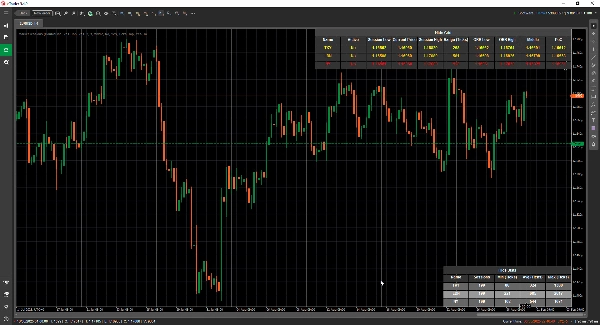
- Panneau de statistiques – affichez le nombre total de sessions, les plages min, moy et max pour chaque session (en ticks, pips ou %)
- Mode grille - vous permet de voir les sessions actives actuelles dans un tableau, afin de visualiser les sessions sur une période plus longue.
- Configuration flexible – personnalisez le placement du texte, les modes de plage, les préférences de dessin et les thèmes
- Alertes et intégrations – intégration Telegram/Discord avec alertes sonores et visuelles
📦 Ce que vous obtenez
- MarketSessions.algo (prêt à l’emploi)
- Mises à jour à vie (sans frais récurrents)
- Support convivial (accès direct si vous avez besoin d’aide)
💻 Exigences
- plateforme cTrader
- runtime .NET 6.0
✅ Installation en quelques minutes
✅ Tradez en toute confiance
📘 Référence des paramètres (version conviviale)
Liste des sessions disponibles
- New York
- Londres
- Francfort
- Tokyo
- Hong Kong
- Shanghai
- Singapour
- Wellington
- Sydney
- Toronto
Paramètres généraux
- Mode de dessin – Choisissez comment les lignes de session sont dessinées sur le graphique (Rectangle / Double ligne / Ligne médiane)
- Afficher le nom de la session – Affichez le nom de chaque session directement sur votre graphique
- Emplacement du nom de la session – Décidez où le texte du nom de session apparaît (haut, centre, bas)
- Texte en gras – Rend le nom de la session en gras pour une lecture plus facile
- Décalage du texte en haut – Ajoute un espacement supplémentaire depuis le haut (pour que le texte ne chevauche pas les chandeliers)
- Décalage du texte en bas – Ajoute un espacement supplémentaire depuis le bas de la zone de session
- Emplacement du temps du texte – Affichez l’heure de la session avec le nom de la session
- Utiliser un nom de session court – Passe à des noms plus courts (ex. NY au lieu de New York)
- Afficher la plage de la session – Mettez en surbrillance toute la plage de prix couverte par la session
- Mode de plage de session – Choisissez comment la plage de prix est calculée (haut/bas ou ouverture/fermeture)
- Emplacement de la plage de session – Placez le marqueur de plage en haut ou en bas de la plage
- Afficher le plus haut – Affiche le prix le plus élevé de la session
- Emplacement du plus haut – Choisissez où l’étiquette du plus haut apparaît
- Afficher le plus bas – Affiche le prix le plus bas de la session
- Emplacement du plus bas – Choisissez où l’étiquette du plus bas apparaît
- Prolonger les lignes Haut/Bas (minutes) - Permet de prolonger ces lignes de x minutes vers l’avant
- Afficher le breakout de la plage d’ouverture – Dessinez une boîte de breakout à l’ouverture de la session
- Prolonger les lignes ORB (minutes) - Permet de prolonger ces lignes de x minutes vers l’avant
- Afficher les lignes médianes – Ajoutez des lignes médianes pour aider à identifier la juste valeur
- Prolonger les lignes médianes (minutes) - Permet de prolonger cette ligne de x minutes vers l’avant
- Afficher le PoC – Affiche le Point de Contrôle (prix le plus échangé de la session)
- Prolonger les lignes médianes (minutes) - Permet de prolonger cette ligne de x minutes vers l’avant
- Transparence du remplissage – Contrôle la transparence du fond de la session
Statistiques
- Afficher les statistiques – Affichez/masquez le panneau de statistiques sur votre graphique
- Alignement horizontal des stats – Alignez le panneau (Gauche / Centre / Droite)
- Alignement vertical des stats – Choisissez si le panneau apparaît en haut ou en bas
- Couleur du titre – Couleur du texte pour le titre « Statistiques »
- Couleur des lignes paires – Couleur de fond pour les lignes paires dans le panneau
- Couleur des lignes impaires – Couleur de fond pour les lignes impaires dans le panneau
- Couleur du premier plan – Couleur du texte utilisée à l’intérieur du panneau
Telegram
- Utiliser – Activez ou désactivez les alertes Telegram
- Token – Votre token de bot Telegram
- ChatId – L’ID du chat où les alertes seront envoyées
Discord
- Utiliser – Activez ou désactivez les alertes Discord
- WebhookUrl – URL du webhook Discord pour l’envoi des alertes de session
Alertes sonores
- Alerte sonore nouvelle session – Joue un son lorsqu’une nouvelle session commence
- Alerte sonore session terminée – Joue un son lorsqu’une session se termine
Grille
- Forcer la grille - Force le rendu de la grille indépendamment du TimeFrame utilisé
- Grille visible pour TimeFrame supérieur - Vous permet de sélectionner à partir de quel TimeFrame cette grille est visible
- Notification boîte de message - Informe pourquoi le mode de rendu normal n’est pas possible et bascule en mode grille
- Alignement horizontal de la grille
- Alignement vertical de la grille
Exemple de session (New York)
⚠️ Les mêmes paramètres s’appliquent à chaque session (Londres, Tokyo, Sydney, etc.)
- Actif – Activez ou désactivez cette session spécifique
- Couleur – Couleur de la session utilisée sur le graphique
- Remplir la région – Remplissez l’arrière-plan de la zone de session
- Style de ligne – Choisissez le style de ligne (plein, pointillé, etc.)
- Épaisseur de ligne – Contrôlez l’épaisseur des bordures de session
Faites de l’horloge du marché votre alliée
Procurez-vous MarketSessions aujourd’hui et ne manquez plus jamais une session rentable.


