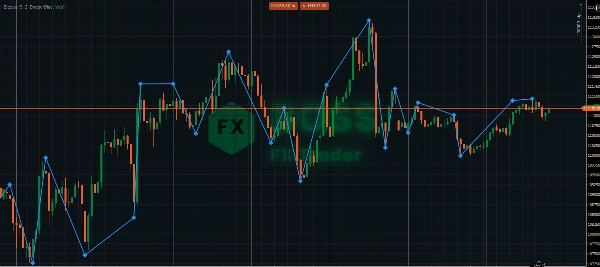
"Zigzag" 标识
Zigzag
"Zigzag" 已上传图片
"Zigzag" 已上传图片
注册日期 29/05/2025
3.03M
交易量
43.92K
盈利点数
26
销售
608
免费安装

The ZigZag Indicator is a market structure tool that filters out small price fluctuations and highlights major swing highs and lows. By connecting these points with lines, traders can easily identify trends, reversals, and chart patterns.

It does not generate buy/sell signals by itself, but when combined with price action, support/resistance, or other indicators, it becomes powerful for scalping, intraday, and swing strategies.


🔎 Key Features

  • Simplifies market noise by showing clear price swings.
  • Helps identify support and resistance levels.
  • Useful for spotting chart patterns (head & shoulders, double tops/bottoms, triangles).
  • Assists in trend confirmation and pullback entries.


⚡ Scalping with ZigZag

  • Timeframes: 1m – 5m
  • Goal: Catch small but frequent moves.
  • How to Use:
    1. Wait for a new swing high/low to form.
    2. Mark these as micro-support or resistance.
    3. Enter trades on breakouts or pullbacks to these ZigZag levels.
    4. Keep stop-loss just beyond the last swing (tight risk).
    5. Aim for quick TP (5–15 pips depending on volatility).

👉 Works best in high volatility sessions (London / New York open).


⏱️ Intraday Trading with ZigZag

  • Timeframes: 15m – 1H
  • Goal: Trade daily trends and key intraday reversals.
  • How to Use:
    1. Identify the main intraday trend using higher ZigZag swings.
    2. Use ZigZag points as pivot zones for entry (buy dips in uptrend, sell rallies in downtrend).
    3. Combine with oscillators (RSI/Stochastic) to confirm overbought/oversold near ZigZag extremes.
    4. Use previous swing high/low as logical SL/TP levels.

👉 Great for day traders who want 20–50 pip moves.


📆 Swing Trading with ZigZag

  • Timeframes: 4H – Daily
  • Goal: Catch large trend moves and position trades.
  • How to Use:
    1. Use ZigZag to identify major market structure (higher highs & higher lows = uptrend).
    2. Enter after pullbacks when a new swing low forms in an uptrend.
    3. Place SL below last major swing low.
    4. Target 2–3x risk, or next ZigZag swing level.
    5. Use ZigZag to spot reversal patterns (double top/bottom, head & shoulders) for exits.

👉 Ideal for holding trades for days to weeks.


📌 Pro Tips

  • Adjust Depth: Smaller = more sensitive (good for scalping). Larger = filters noise (better for swing).
  • Combine with volume, trend filters, or moving averages for confirmation.
  • Always check higher timeframe ZigZag before entering — small swings inside a bigger trend can be traps.
  • Use ZigZag for chart pattern validation (triangles, wedges).


Stay profitable traders!

Indicator profile
0.0
评价:0
客户评价
该产品尚无评价。已经试过了?抢先告诉其他人!
BTCUSD
Forex
Signal
Breakout
Indices
EURUSD
Commodities
GBPUSD
NZDUSD
Prop
Scalping
Crypto
AI
Stocks
XAUUSD
NAS100
USDJPY
Products available through cTrader Store, including trading bots, indicators and plugins, are provided by third-party developers and made available for informational and technical access purposes only. cTrader Store is not a broker and does not provide investment advice, personal recommendations or any guarantee of future performance.

该作者的其他作品

Market Sessions is very important for traders.
Fractal Arrow Buy and Sell Indicator
The Break of Structure (BoSCHoCh) Indicator is a smart market structure tool designed to help traders easily spot trend.
Quick Trading Panel Cbot allows you to trade faster using a panel in a chart. This includes Trailing Trigger and Locked.
3
盈利系数
0%
最大回撤
Area of Interest with the power of AI to detect the market interest.
Candle Timer best used for Scalper
The ZigZag Trend is a market structure tool that filters out small price fluctuations and highlights major swing.
MultiTF Pivot and SR Indicator
The Fibonacci Automated Levels Indicator is a smart trading tool that automatically detects the most recent market.
Volume Meter
The Market BIAS Detector is a smart trading assistant designed to identify the market.
Spread Calculator to calculate the difference between two prices or values.

猜您喜欢

Unlock trading precision with QQE! Dual QQE indicators with a Bollinger Bands zero line provide clear buy/sell signals.
Exhaustion Hunter by BeyondTrading — When price hits the limit, the reversal is next.
A visual indicator designed to help traders identify and track market activity across different trading sessions.
This indicator is designed to perform multiple non-linear regression analysis using four independent variables.
Draws support and resistance on all pairs.
Anchored VWAP Buttons
A metric that can set 1 to 3 groups of Bollinger Bands
Inside Candle PRO - Professional Inside Bar Pattern Detector
This Indicator will show you Direction, Distance, and Time;
"Detects swings 🎯, draws zigzag trends 📈📉, support/resistance ⏹️, labels HH/HL/LH/LL, Tracks market structure 🚀🐻."
Detects FVGs, converts invalidated gaps into Inverse FVGs (iFVG) with flipped bias, and tracks retest & mitigation.
Adaptive KAMA: fast in trend, slow in noise — with color-coded market state visualization.
The standard Relative Strength Index (RSI), RSI & Signal Cloud, Smart Volatility Filter (ATR), On-Chart Info Dashboard
This is an indicator that can alert you about trendlines, horizontal lines and vertical lines.
Elliott Wave Structure Pro v2.0 (Non-Repainting) Structure, Elliott, Continuation Entries
Daily High & Low with live Percentage change.
Boost your trading with Candlestick Patterns for cTrader – auto-detect key signals for smarter, faster decisions!
注册日期 29/05/2025
3.03M
交易量
43.92K
盈利点数
26
销售
608
免费安装