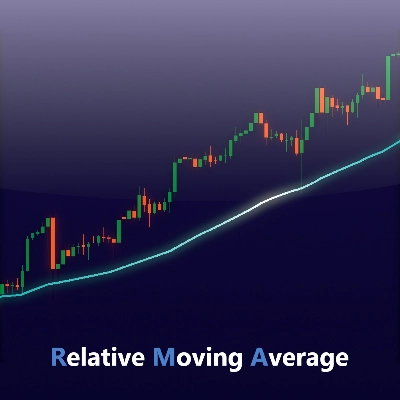
介绍 相对移动平均线 (RMA) 指标,现在可用于 cTrader!
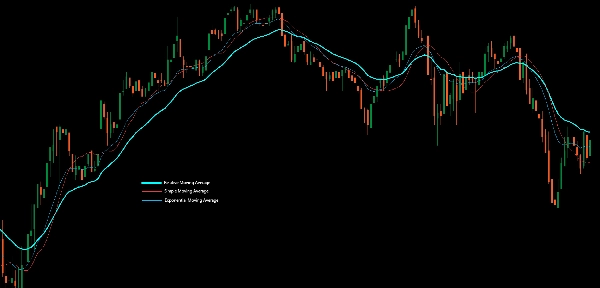
这款 相对移动平均线 (RMA) — 也称为 平滑移动平均线 (SMMA) — 是一种旨在减少滞后同时保持曲线平滑的移动平均线。它使用的公式与 TradingView 内置的“RMA” 函数相同,该函数广泛应用于流行指标如 相对强弱指数 (RSI) 中。
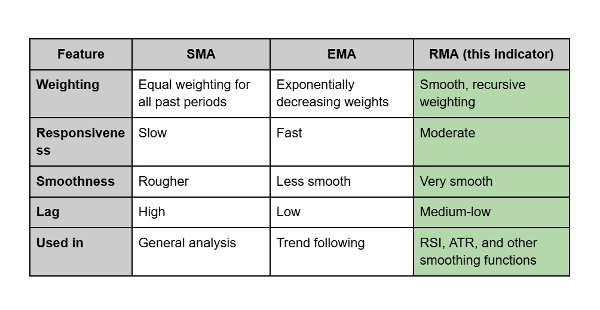
RMA 旨在平衡响应速度和稳定性。它比 指数移动平均线 (EMA) 更新更平滑,但比 简单移动平均线 (SMA) 对价格变化反应更快。
它的不同之处:
- SMA 对所有价格赋予相同权重,导致滞后和波动性较大。
- EMA 更重视近期价格,反应非常灵敏,但有时噪音较大。
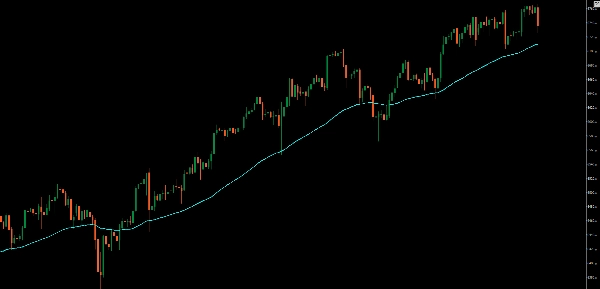
- RMA 则结合了两者的优点:它平滑了波动性,同时保持对价格变化的及时反应。
实际应用:
交易者常将 RMA 用作 更平滑的趋势线 或作为 动量指标 的一部分。当您想过滤噪音而不引入显著滞后时,它特别有效——非常适合确认长期趋势或支持超买/超卖分析。
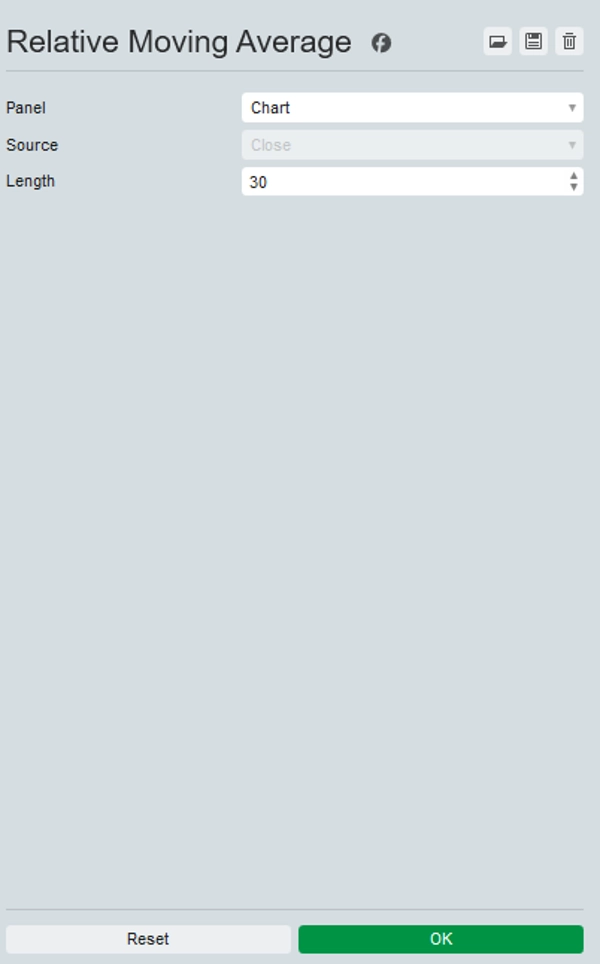
指标配置
0.0
评价:0
客户评价
该产品尚无评价。已经试过了?抢先告诉其他人!
BTCUSD
Forex
Indices
EURUSD
Commodities
GBPUSD
NZDUSD
Prop
Crypto
Stocks
XAUUSD
NAS100
USDJPY
cTrader Store 提供的所有产品,包括交易机器人、指标和插件,均由第三方开发者提供,仅供信息参考和技术访问之用。cTrader Store 并非经纪商,不提供投资建议、个人推荐或任何未来业绩保证。


注册日期 25/09/2025
25
销售
314
免费安装