说明
货币对强度(JPY)- 货币强度指标
📊 什么是货币对强度(JPY)?
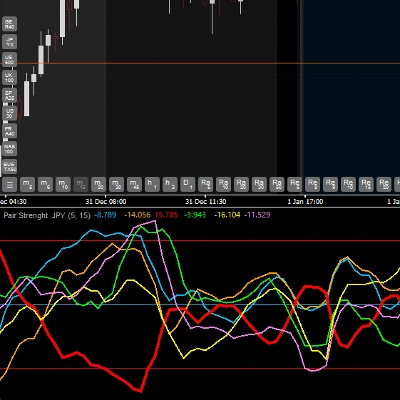
货币对强度(JPY)是一种高级指标,实时分析和比较六种主要货币的相对强度: 欧元(EUR)、英镑(GBP)、日元(JPY)、美元(USD)、澳元(AUD)和加元(CAD)。它使用真实强度指数(TSI)来衡量每种货币的动量和强度,帮助您识别市场中哪些货币更强或更弱。
🎯 主要特点
✅ 多货币分析:在一个窗口中同时监控6种货币 ✅ 趋势识别:检测市场中最强和最弱的货币 ✅ 超买/超卖信号:50、0和-50水平用于识别极端情况 ✅ 交易确认:通过比较相对强度帮助验证您的入场点 ✅ 直观清晰:每种货币都有自己的颜色,便于识别
💹 兼容货币对
重要:该指标分析6种货币的强度: 欧元(EUR)、英镑(GBP)、日元(JPY)、美元(USD)、澳元(AUD)和加元(CAD)
该指标仅适用于包含日元(JPY)的货币对,具体包括:
- EURJPY(欧元/日元)
- GBPJPY(英镑/日元)
- USDJPY(美元/日元)
- AUDJPY(澳元/日元)
- CADJPY(加元/日元)
⚠️ 您的经纪商必须提供这5个包含JPY的货币对,指标才能正常工作。
不适用于:
- 黄金、白银或其他金属
- 股票指数
- 加密货币
- 不包含JPY的货币对(如EURUSD、GBPUSD等)
您可以将指标应用于上述任意5个货币对的图表。
📈 如何使用该指标
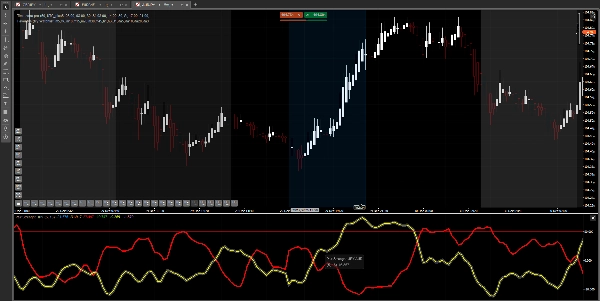
线条解读:
每条彩色线代表一种货币的强度:
- 线条向上(正值):货币强势
- 线条向下(负值):货币弱势
- 线条交叉:货币间相对强度变化
关键水平:
- 50水平:超买区 - 货币可能非常强劲且接近反转
- 0水平:中性线 - 强弱平衡
- -50水平:超卖区 - 货币可能非常弱且接近反转
基本策略:
- 识别最强货币(最高线)
- 识别最弱货币(最低线)
- 交易结合两者的货币对(例如:如果欧元强而日元弱 → 买入EURJPY)
- 结合关键水平确认:避免在强势货币处于+50时买入,或弱势货币处于-50时卖出
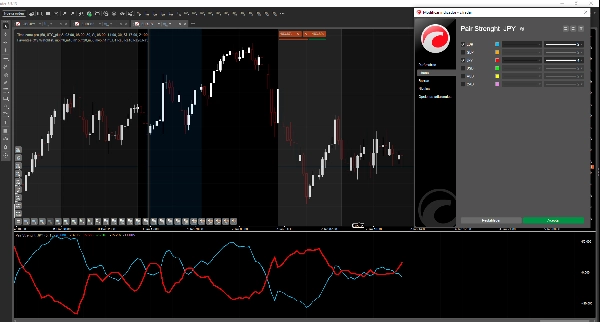
⚙️ 可调参数
- 快速周期(默认:5):TSI的快速周期 - 数值越低,灵敏度越高
- 慢速周期(默认:15):TSI的慢速周期 - 数值越高,曲线越平滑
默认值适用于大多数情况。请根据您的交易风格进行调整。
🔮 未来更新
我们正在评估未来版本中添加更多货币对(如纽元NZD、瑞士法郎CHF等)的可能性,具体取决于用户反馈和需求。但这并不保证,最终将视指标表现和市场需求而定。
💡 使用提示
✓ 与您的主要策略结合使用,而非单独系统 ✓ 结合价格行为分析和支撑/阻力位 ✓ 先在模拟账户练习再进行实盘交易 ✓ 并非所有信号都能盈利 - 需合理风险管理 ✓ 最适合M15及以上时间框架
📞 支持
如果您对指标的安装或使用有疑问,请联系我们。
最后说明:该指标是一个分析工具。交易成功取决于多种因素,包括风险管理、心理素质和经验。
摘要
客户评价
5 | 100 % | |
4 | 0 % | |
3 | 0 % | |
2 | 0 % | |
1 | 0 % |


