
Cup Finder
Indicatore
120 download
Versione 1.0, Feb 2026
Windows, Mac
Descrizione
Il Cup Finder:
È un indicatore tecnico ad alta precisione progettato per identificare e convalidare strutture di prezzo arrotondate—comunemente note come "Cups" e "Inverted Cups"—utilizzando la geometria euclidea e la convalida basata sulla densità.
📊 Analisi e Condizioni di Mercato
https://chartshots.spotware.com/c/6980ec8b2ee38
Questo indicatore analizza i pivot di prezzo Massimi e Minimi all'interno di un periodo storico specifico di analisi. Cerca specificamente:
- Curvatura del Prezzo: Identifica picchi o avvallamenti locali (finestra di 30 barre) per stabilire l'"ancora" di un potenziale modello.
- Percorso Geometrico: Proietta un arco semicircolare matematico tra l'ancora e il prezzo corrente.
- Convalida della Densità: A differenza degli strumenti solo visivi, calcola se una percentuale minima di barre (Content Rate) è rimasta all'interno di un canale di prezzo specifico attorno all'arco.
🟢 Come Interpretare Segnali e Visualizzazioni
https://chartshots.spotware.com/c/6980ed1a2d9e9
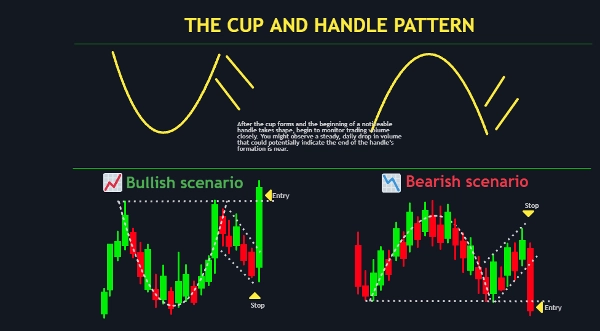
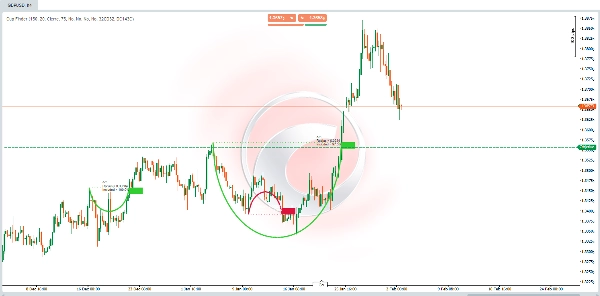
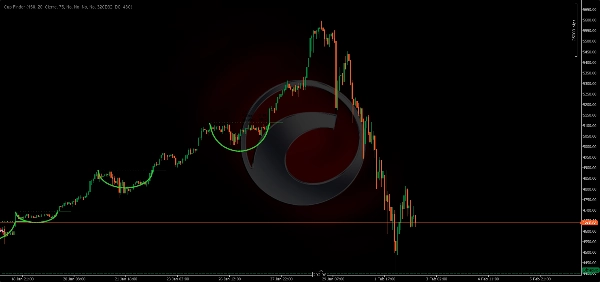
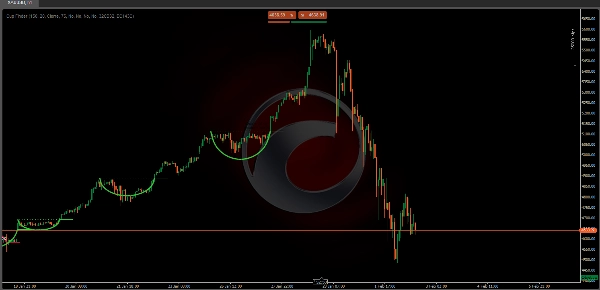
- Archi Verdi (Rialzisti): Indicano una formazione di fondo arrotondato. Cercate la linea tratteggiata orizzontale, che rappresenta il livello di resistenza "bordo".
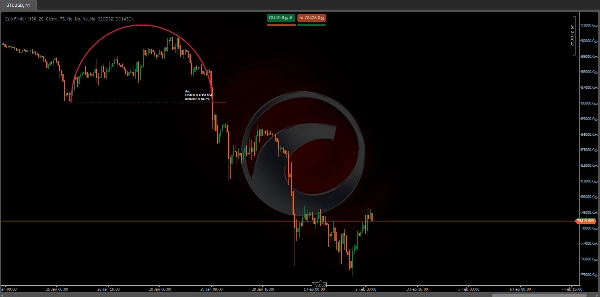
- Archi Rossi (Ribassisti): Indicano una formazione di testa arrotondata (volta). La linea tratteggiata orizzontale segna il livello di supporto da monitorare.
- Etichette Informative:
-
- Raggio: Mostra la profondità del modello in unità di prezzo.
- % Inclusa: Il punteggio di "Precisione Geometrica". Una percentuale più alta significa che il prezzo ha seguito la curva più rigorosamente.
⚙️ Impostazioni e Parametri Chiave
- Periodo di Ricerca (Predefinito: 150): Il numero di barre che l'algoritmo esamina per trovare un'ancora storica valida.
- Ampiezza del Canale (Predefinito: 20): Definisce lo "spessore" della zona di convalida dell'arco. Valori più alti sono più permissivi con il rumore del prezzo.
- Percentuale Contenuto % (Predefinito: 75): La percentuale minima di barre che devono rimanere all'interno dell'arco affinché venga visualizzato.
- Fonte del Breakout: Scegli se il modello è attivato da una Chiusura o dall'Alto/Basso che attraversa la linea del bordo.
🚀 Casi d'Uso e Scenari Tipici
https://chartshots.spotware.com/c/6980eefccbe38
- Trading di Breakout: Entra in una posizione quando il prezzo rompe e chiude sopra/sotto la linea tratteggiata orizzontale (il bordo).
- Identificazione di Inversione di Tendenza: Individuazione di "Fondi Arrotondati" alla fine di un trend ribassista o "Massimi Arrotondati" alla fine di un trend rialzista.
- Supporto/Resistenza Strutturale: Utilizzo della linea del bordo come livello chiave per posizionare Stop Loss o prendere profitti.
👤 Profilo del Trader Target
- Trader Price Action: Coloro che cercano la geometria del mercato e l'esaurimento strutturale.
- Trader Sistematici: Utenti che vogliono eliminare la soggettività del "disegnare cup" a mano e preferiscono una conferma matematica.
- Livello di Esperienza: Adatto a trader da intermedi ad avanzati che comprendono la conferma del breakout e i concetti di supporto/resistenza.
⚠️ Limitazioni Importanti e Note sull'Uso
- Storia Minima Richiesta: L'indicatore richiede almeno 292 barre di dati per inizializzare i suoi calcoli interni.
- Natura Ritardata: Poiché convalida una curva basata su dati storici, l'arco appare solo una volta che l'"arrotondamento" è sostanzialmente sviluppato.
- Ritocco/Aggiornamento: Man mano che il prezzo si sviluppa, l'arco può regolare il suo raggio o scomparire se la "% Inclusa" scende sotto la soglia impostata.
Riepilogo
Riepilogo AI
Cup Finder is a technical indicator designed to identify and validate rounding price patterns known as "Cups" and "Inverted Cups" using Euclidean geometry and density-based validation. It analyzes high and low price pivots over a historical lookback period to detect price curvature by identifying local peaks or troughs within a 30-bar window, establishing an anchor point for potential patterns. The indicator projects a semicircular arc between this anchor and the current price and calculates a content rate to confirm that a minimum percentage of bars remain within a defined price channel around the arc.
Visual signals include green arcs indicating bullish rounding bottoms with a horizontal dotted resistance line, and red arcs indicating bearish rounding tops with a support line. Information labels display the pattern's radius and geometric accuracy percentage. Key adjustable parameters include search period, channel amplitude, content rate threshold, and breakout source (close or high/low crossing the rim line).
Typical use cases involve breakout trading, trend reversal identification, and defining structural support or resistance levels. The indicator targets intermediate to advanced price action and systematic traders seeking mathematical confirmation of rounding patterns. It requires at least 292 bars of historical data and may repaint or update arcs as price evolves. Supported markets include Forex, stocks, commodities, indices, and cryptocurrencies such as BTCUSD, EURUSD, GBPUSD, and XAUUSD.
Profilo indicatore
Recensioni dei clienti
0.0
Recensioni: 0
Recensioni dei clienti
Questo prodotto non ha ancora ricevuto recensioni. L'hai già provato? Fallo sapere agli altri per primo!
Discussioni
Domande frequenti
BTCUSD
Forex
Breakout
Indices
EURUSD
Commodities
GBPUSD
NZDUSD
Prop
Crypto
Stocks
XAUUSD
NAS100
USDJPY
I prodotti disponibili tramite cTrader Store, inclusi bot di trading, indicatori e plugin, sono forniti da sviluppatori terzi e resi disponibili esclusivamente a scopo informativo e di accesso tecnico. cTrader Store non è un broker e non fornisce consulenze in materia di investimento, raccomandazioni individualizzate o garanzie di risultati futuri.


Prezzo
Da 03/10/2024
163
Vendite
38.54K
Installazioni gratuite