Descripción
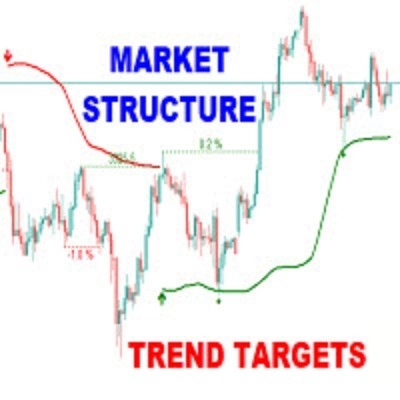
Los Objetivos de Tendencia de la Estructura del Mercado es un indicador de trading poderoso diseñado para ofrecer a los traders una visión clara, estructurada y basada en datos del impulso del mercado, rupturas y zonas clave de reacción del precio. Construido sobre los principios de análisis inteligente de la estructura del mercado, ayuda a identificar no solo la dirección de la tendencia, sino también niveles precisos de ruptura, agotamiento de la tendencia, y zonas potenciales de reversión — todo con claridad visual y métricas amigables para el trader.
Características Clave
Puntos de Ruptura con Marcadores Numerados
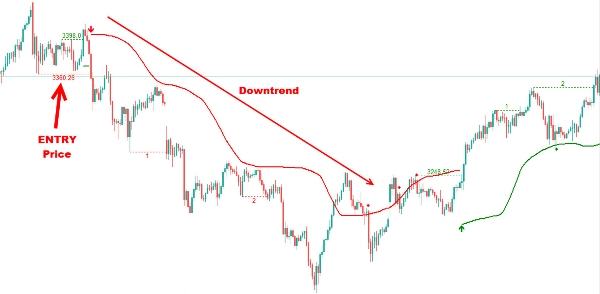
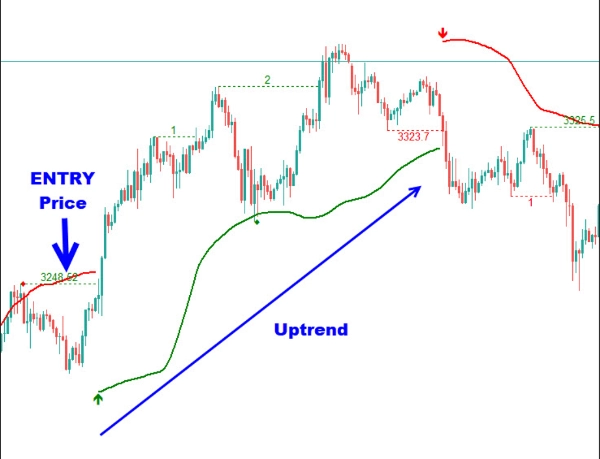
Sigue rupturas estructurales significativas con marcadores numerados secuenciales, ayudándote a seguir visualmente la progresión de la acción del precio. Ya sea que el mercado esté en una tendencia alcista o bajista, cada punto de ruptura se registra y muestra para facilitar el seguimiento y la confirmación de cambios estructurales. La ruptura inicial (ruptura cero) se marca con el precio de entrada y un icono de flecha, mientras que las rupturas subsecuentes dentro de la tendencia se numeran secuencialmente (1, 2, 3…) para indicar la continuación de la tendencia.
Cambio Porcentual
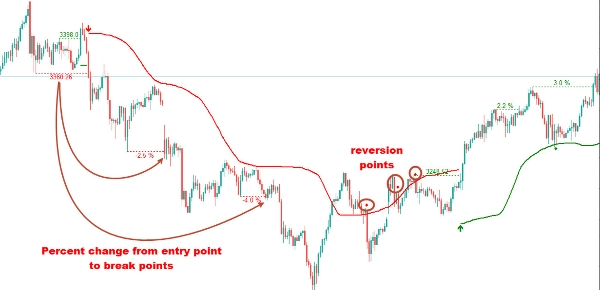
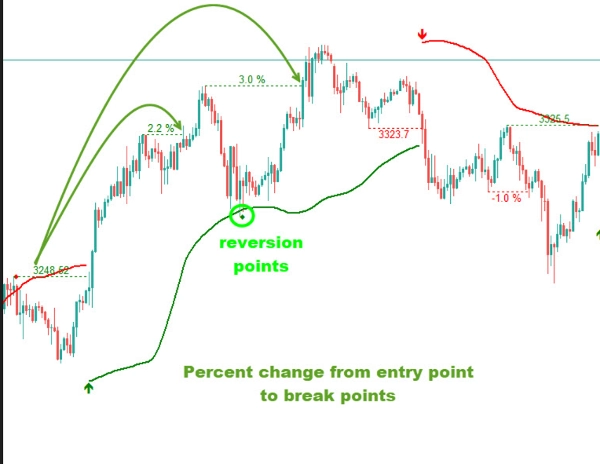
Ve exactamente cuánto se ha movido el precio desde cada punto de ruptura con etiquetas de cambio porcentual. Esto te da una sensación en tiempo real de la fuerza del mercado, volatilidad y posible agotamiento, ayudándote a evaluar si un movimiento aún tiene impulso — o está cerca de su límite.
Niveles de Stop Loss Dinámicos
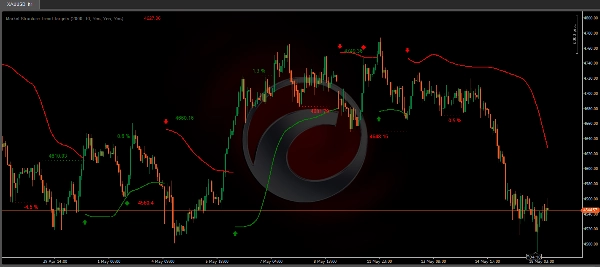
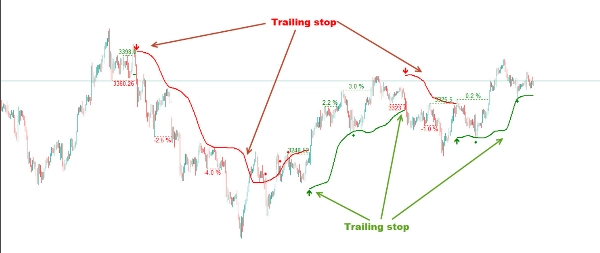
Este indicador calcula automáticamente niveles dinámicos de stop loss basados en pivotes estructurales recientes, confirmación de ruptura y volatilidad. Estos niveles inteligentes se ajustan a medida que el precio se mueve, ayudando a los traders a seguir las tendencias mientras gestionan el riesgo con precisión. Si el precio rompe el nivel de stop loss, el indicador mostrará puntos que indican un posible fin o reversión de la tendencia.
Señales de Reversión
El indicador identifica posibles puntos de reversión a la media con iconos de diamante. En una tendencia alcista, si el precio cae por debajo del stop loss y luego vuelve a entrar por encima, se traza un diamante, sugiriendo una posible reversión a la media. De manera similar, en una tendencia bajista, si el precio se mueve por encima del stop loss y luego vuelve a caer por debajo, indica una posibilidad de reversión.
Casos de Uso:
- Estrategias de seguimiento de tendencia basadas en la estructura del mercado
- Confirmación para configuraciones de Conceptos de Dinero Inteligente (SMC)
- Colocación dinámica de objetivos y stops para traders swing e intradía
- Registro visual de operaciones y seguimiento de rupturas
Entradas del Usuario:
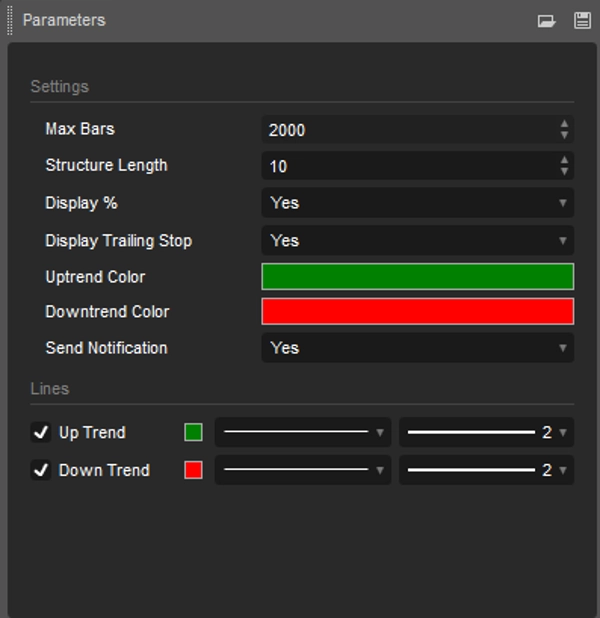
- Longitud: Define el número de barras usadas para identificar los pivotes altos y bajos para rupturas de tendencia.
- Mostrar Porcentaje: Opción para alternar entre mostrar números secuenciales de ruptura o el cambio porcentual desde la ruptura inicial.
- Mostrar Stop Dinámico: Mostrar stop dinámico en el gráfico
- Colores para Tendencia Alcista y Bajista: Permite personalizar las zonas de color para tendencias alcistas y bajistas para que coincidan con las preferencias individuales del gráfico.
- Alerta/Notificación: Permite enviar alerta o notificación al móvil
Los Objetivos de Tendencia de la Estructura del Mercado transforma la acción del precio en información accionable y fácil de leer — brindando a los traders una ventaja táctica con claridad, control y confianza.
Resumen
Key features include:
- Sequential numbered markers for breakout points, starting with an initial breakout marked by an entry price and arrow, followed by numbered continuation breakouts.
- Percentage change labels showing price movement from each breakout point to assess market strength and potential exhaustion.
- Dynamic trailing stop loss levels calculated from recent pivots and volatility, adjusting as price moves to help manage risk and trail trends.
- Reversion signals marked by diamond icons indicating possible mean reversion points when price crosses trailing stops in either trend direction.
User inputs allow customization of pivot length, display options for breakout numbers or percentage changes, trailing stop visibility, color settings for uptrends and downtrends, and alert notifications.
Use cases include trend-following strategies, confirmation for Smart Money Concepts setups, dynamic target and stop placement for swing and intraday trading, and visual trade journaling with breakout tracking. The indicator outputs visual signals on price charts to support decision-making based on market structure shifts.