Описание
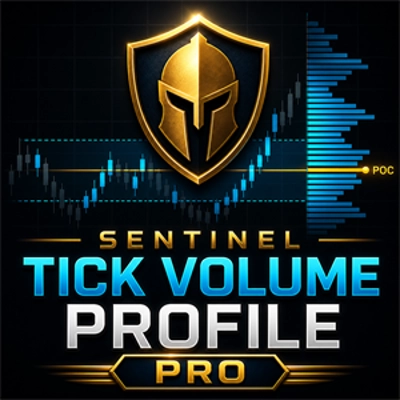
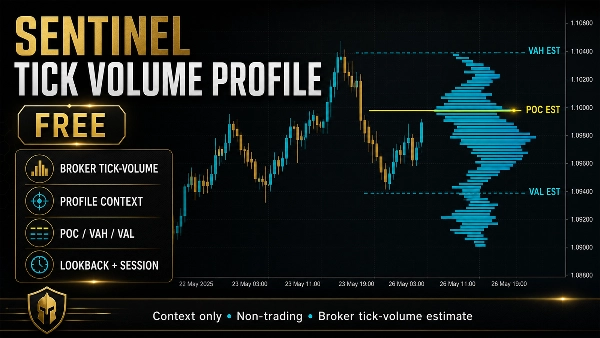
Sentinel Tick Volume Profile Free — это не торговый индикатор cTrader, который преобразует доступные данные о тиковом объеме графика в визуальный профиль распределения цены. Он предназначен для помощи ручным трейдерам в понимании того, где была сосредоточена тиковая активность в выбранном диапазоне графика.
Индикатор работает в три основных этапа:
1. Выбор диапазона профиля
Сначала индикатор определяет, какие бары должны быть включены в расчет профиля.
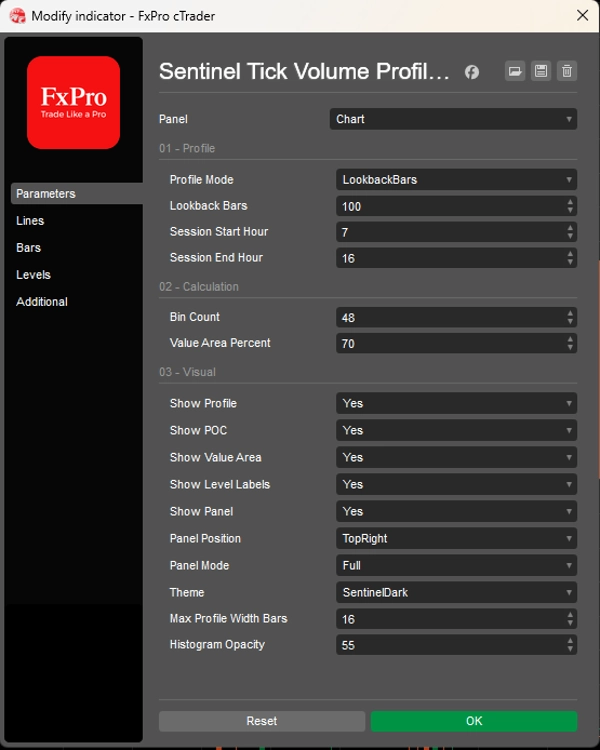
Существует два режима диапазона:
Lookback Bars
Использует фиксированное количество последних баров графика. Например, если Lookback Bars установлен на 240, индикатор строит профиль из последних 240 баров, доступных на графике.
Current Session
Использует настроенные часы начала и окончания сессии. Часы сессии интерпретируются с использованием времени графика индикатора. Индикатор может обрабатывать активные сессии, завершённые сессии, предыдущие сессии и ночные сессии.
Этот выбор диапазона определяет ценовую область и выборку тикового объема, используемую для профиля.
2. Построение профиля тикового объема
После выбора диапазона индикатор делит выбранный ценовой диапазон от максимума до минимума на настраиваемое количество ценовых корзин.
Тиковый объем брокера каждого бара затем распределяется по корзинам, затронутым диапазоном максимум-минимум этого бара.
Это создаёт оценочное распределение тикового объема по ценовым уровням.
Из этого распределения индикатор вычисляет:
Оценочный POC
Ценовую корзину с наибольшей концентрацией тикового объема брокера.
Оценочный VAH
Верхнюю границу оценочной зоны стоимости.
Оценочный VAL
Нижнюю границу оценочной зоны стоимости.
Оценочная зона стоимости
Область вокруг оценочного POC, содержащая выбранный процент от общего тикового объема. Значение по умолчанию для зоны стоимости — 70%.
Эти значения являются оценками на основе данных тикового объема брокера. Они не являются уровнями объема, предоставленными биржей.
3. Отображение профиля на графике
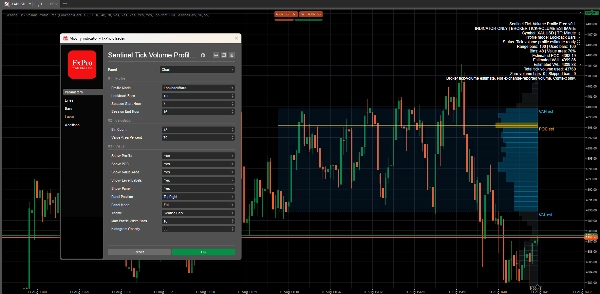
Затем индикатор отображает рассчитанный профиль в виде визуального контекста графика.
Он может показывать:
- Гистограмму профиля тикового объема
- Линию оценочного POC
- Линию оценочного VAH
- Линию оценочного VAL
- Затенение зоны стоимости
- Компактные метки графика: оценка POC, оценка VAH и оценка VAL
- Сводка панели с выбранным режимом профиля, деталями диапазона, количеством корзин, оценочными уровнями, общим используемым тиковым объемом и текстом ограничений
Метки графика можно включать или отключать. Профиль, POC, зона стоимости и панель также могут управляться отдельно.
РЕЖИМЫ ПАНЕЛИ
Индикатор включает три режима панели:
Полный
Показывает наиболее полную информацию, включая бары диапазона, использованные бары, количество корзин, процент зоны стоимости, оценочный POC, оценочный VAH, оценочный VAL, общий используемый тиковый объем, бары с нулевым объемом, пропущенные бары и ограничение тикового объема брокера.
Компактный
Показывает краткую сводку с режимом, количеством корзин, статусом, оценочным POC и диапазоном зоны стоимости.
Минимальный
Показывает очень компактный однострочный статус, сосредоточенный на оценочном POC и ограничениях только контекста.
Важное ограничение данных
Sentinel Tick Volume Profile Free использует данные тикового объема брокера с графика. Он не использует объем, предоставленный биржей, объем фьючерсов, данные footprint, дельту, данные ленты или институциональные данные по потоку ордеров.
Поэтому профиль лучше всего понимать как оценку профиля тикового объема брокера.
Значения могут варьироваться в зависимости от брокера, символа, таймфрейма, сессии и доступной истории графика.
Что индикатор не делает
Sentinel Tick Volume Profile Free не размещает ордера, не изменяет позиции, не закрывает сделки, не управляет сделками и не контролирует cBots.
Он не предоставляет сигналы на покупку, сигналы на продажу, подтверждение входа, инструкции по торговле, прогнозы рынка, оценки коэффициента выигрыша, прогнозы производительности или утверждения о прибыльности.
Это только инструмент визуального контекста для ручного использования.
Сводка
The indicator divides the high-to-low price range of the selected bars into configurable price bins, allocating tick volume across these bins to estimate volume distribution by price level. It calculates key estimated levels including the Point of Control (POC)—the price bin with the highest tick volume concentration—along with the Value Area High (VAH), Value Area Low (VAL), and the Value Area itself, which by default covers 70% of total tick volume.
The profile is displayed visually on the chart with options to show a histogram, estimated POC, VAH, VAL lines, value-area shading, and compact labels. A panel provides summary information in three modes (Full, Compact, Minimal) detailing profile parameters and volume data. The indicator uses broker tick-volume data only and does not execute trades or provide trading signals. It serves as a manual visual tool to enhance market context understanding.