
说明
什么是LTtradingBox?
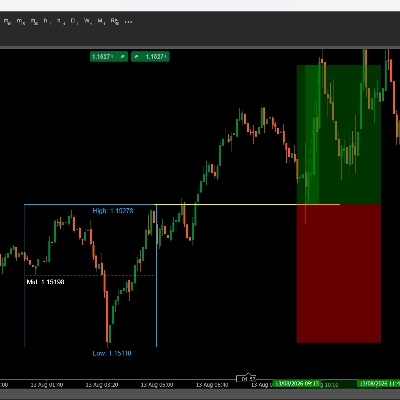
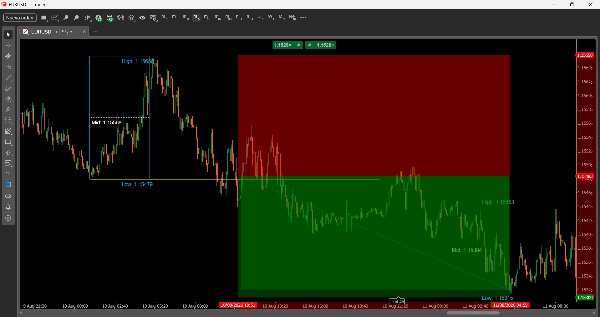
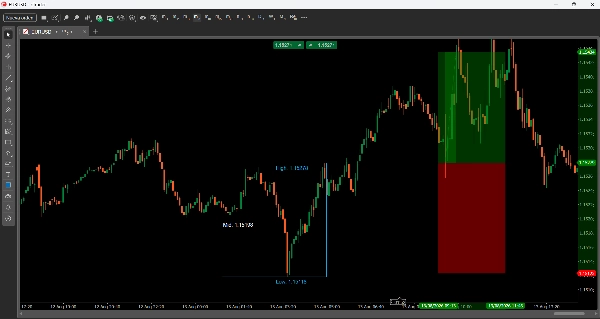
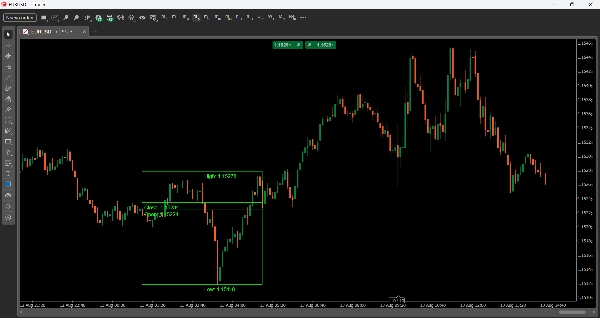
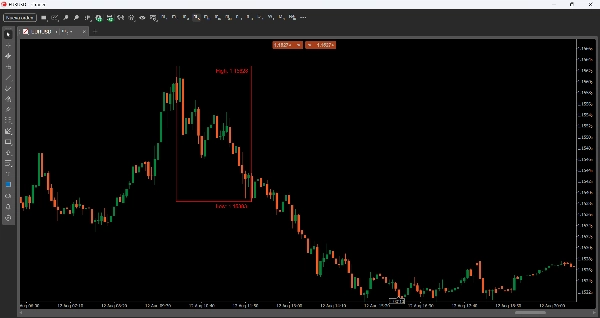
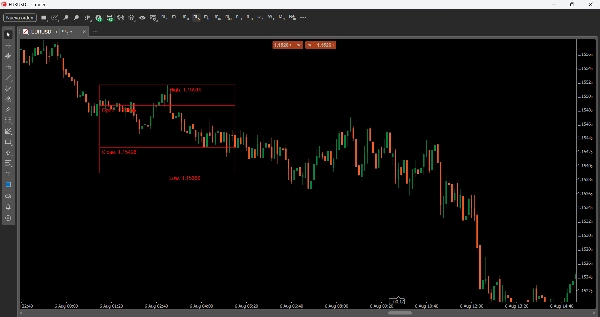
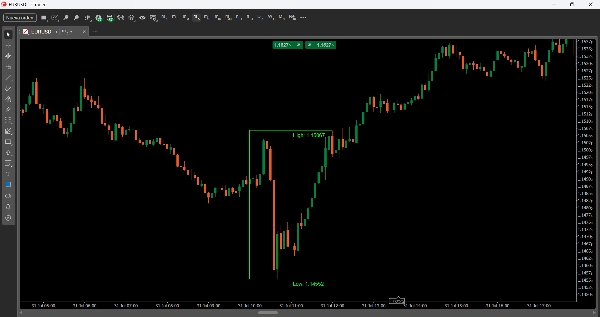
LTtradingBox 以可视化方式标记您定义的时间窗口的价格区间(高点、低点、开盘价和收盘价)——例如伦敦或纽约交易时段。该框会根据该时段的结果自动更改颜色:如果收盘看涨则为绿色,收盘看跌则为红色,中性则为灰色(或您为每种情况选择的颜色)。它还添加了参考线(中间价、中间时间)和可选的视觉填充,帮助您一目了然地识别流动性区域、积累区间和关键交易水平。
参数
时间设置
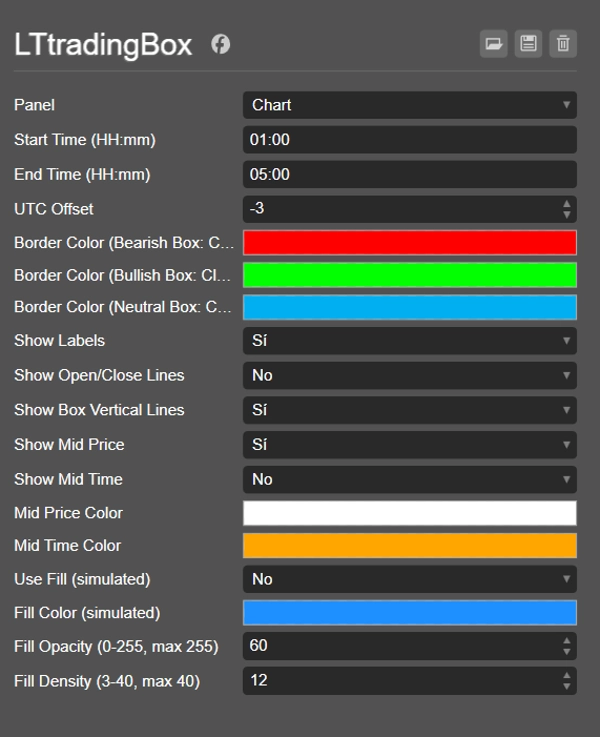
- 开始时间(HH:mm) — 框的开始时间(24小时制)。
- 结束时间(HH:mm) — 框的结束时间。
- UTC偏移 — 时间调整,使框与您的本地时间或您想跟踪的时段(例如伦敦、纽约、亚洲)对齐,无论您的经纪商时区如何。
颜色
- 边框颜色(看跌框:收盘价 < 开盘价) — 框收盘看跌时的边框颜色。
- 边框颜色(看涨框:收盘价 > 开盘价) — 框收盘看涨时的边框颜色。
- 边框颜色(中性框:收盘价 == 开盘价) — 收盘价等于开盘价时的边框颜色。
显示选项
- 显示标签 — 切换显示高点、低点、开盘价和收盘价的文本标签。
- 显示开盘/收盘线 — 绘制标记框内开盘价和收盘价的水平线。
- 显示框的垂直线 — 启用完整矩形(4条边框);如果禁用,则仅显示高点和低点线。
- 显示中间价 — 在高点和低点之间的中点绘制虚线。
- 显示中间时间 — 在框的时间中点绘制垂直线。
- 中间价颜色 / 中间时间颜色 — 这些线条的可自定义颜色。
填充(视觉填充)
- 使用填充(模拟) — 启用框内的模拟填充(使用叠加的细线)。
- 填充颜色(模拟) — 填充颜色。
- 填充不透明度(0-255,最大255) — 填充的透明度级别。
- 填充密度(3-40,最大40) — 用于模拟填充的线条数量(密度越高=填充越实)。
交易思路
- 突破并回测:等待价格突破框的高点或低点,然后回落以该水平作为支撑/阻力进行回测,之后顺着突破方向入场。
- 极端位置的反转:如果价格触及框的高点或低点但未强力突破,可能表示被拒绝并向框的相反方向移动。
- 按时段的方向偏好:框的颜色快速显示该时段的偏好(看涨/看跌/中性),有助于在后续时段调整入场方向。
- 中间价作为磁铁:中点常作为再平衡区——当价格在强劲冲击后回到中点时寻找入场机会。
- 比较连续的框:由于每个每日框都被保存(通过其日期标签),您可以比较多个连续时段的区间和偏好,发现短期趋势。
摘要
AI 摘要
LTtradingBox is a customizable trading indicator that visually highlights the price range—high, low, open, and close—within any user-defined time window, such as a specific trading session. The indicator draws a colored box representing this range, automatically changing its border color to green for bullish closes, red for bearish closes, or gray for neutral, with customizable color options. It includes reference lines for the midpoint price and midpoint time, which can be displayed as dotted or vertical lines, aiding in identifying liquidity zones, accumulation areas, and key support/resistance levels.
Users can configure start and end times, apply a UTC offset to align with local or session times, and toggle display options such as labels for price points, open/close lines, full box borders, and visual fills with adjustable color, opacity, and density. The indicator supports trading strategies including breakout and retest of box boundaries, reversal signals at extremes, session-based directional bias, and using the midpoint as a rebalancing zone. It also allows comparison of consecutive session boxes to detect short-term trends. LTtradingBox is designed to assist traders in quickly identifying key levels and market structure within chosen timeframes.
Users can configure start and end times, apply a UTC offset to align with local or session times, and toggle display options such as labels for price points, open/close lines, full box borders, and visual fills with adjustable color, opacity, and density. The indicator supports trading strategies including breakout and retest of box boundaries, reversal signals at extremes, session-based directional bias, and using the midpoint as a rebalancing zone. It also allows comparison of consecutive session boxes to detect short-term trends. LTtradingBox is designed to assist traders in quickly identifying key levels and market structure within chosen timeframes.
指标配置
指标分类
支撑与阻力
输出类型
可视化
数据要求
仅 K 线
支持的信号
突破
反转
突破水平位
触及水平位
客户评价
0.0
评价:0
客户评价
该产品尚无评价。已经试过了?抢先告诉其他人!
讨论
常见问答
Key Levels
Support & Resistance
cTrader Store 提供的所有产品,包括交易机器人、指标和插件,均由第三方开发者提供,仅供信息参考和技术访问之用。cTrader Store 并非经纪商,不提供投资建议、个人推荐或任何未来业绩保证。


















价格
注册日期 10/01/2025