present
注册即可在首次购物时获得 $50 优惠
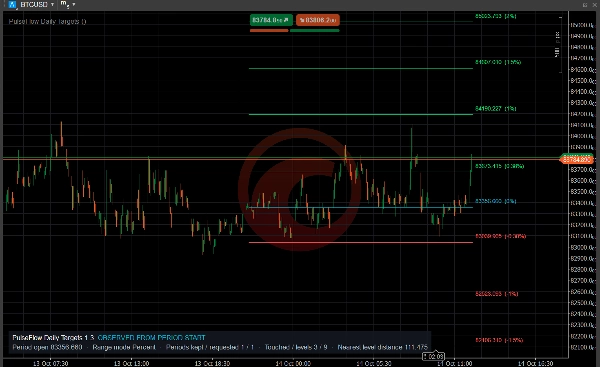
Trading product for PulseFlow Daily Targets 指标 Key Levels Market Structure, image 1
PulseFlow Daily Targets
指标
版本 1.0, Oct 2026
Windows 版、Mac 版
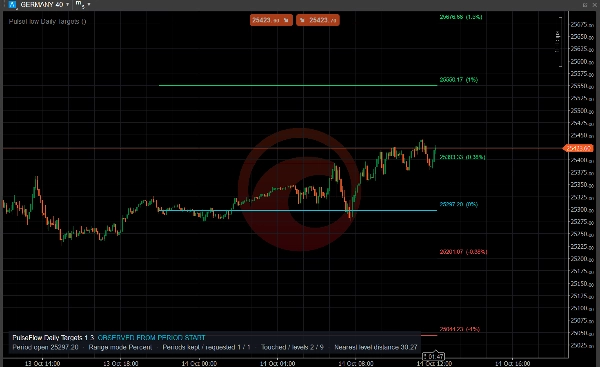
Trading product for PulseFlow Daily Targets 指标 Key Levels Market Structure, image 2
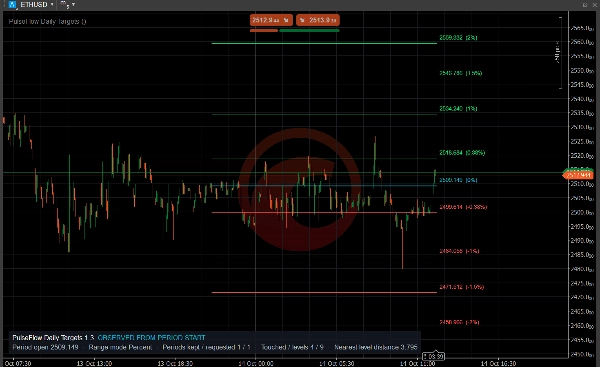
Trading product for PulseFlow Daily Targets 指标 Key Levels Market Structure, image 3
Trading product for PulseFlow Daily Targets 指标 Key Levels Market Structure, image 4
注册日期 14/10/2026

说明

Launch price: $19 until November 14, 2026. After that date, the price returns to $33.

Every trading day opens with a map


PulseFlow Daily Targets draws the day's percentage targets from the opening price. From the first candle you know how far the session has travelled and which level comes next. It helps you make better decisions with clear references.


Why these levels

The opening price is the first price of the day. Many traders measure the session in percentages from it, such as plus 1% or minus 1.5%, and use those distances as targets to take profits, adjust positions and manage risk. That is why these levels are worth keeping in view.


What you get

- An aqua line at the day open, four green levels above it and four red below. By default they sit at ±0.38%, ±1%, ±1.5% and ±2%, and all four distances are configurable to fit your asset and its volatility.

- Spacing in percent, or as a multiple of the daily ATR or ADR. Reference: the day open or the previous close.

- Price labels in the color of their line, with no boxes covering your candles, so you read the exact price of every level.

- Optional fading of levels after their first touch, and a compact panel with the reference, levels touched and the distance to the nearest level.

- Optional cTrader pop-up alerts on the first touch of an upper or lower level.


A fresh map each day

Each trading day the indicator takes the new open and calculates a new set of levels. The lines grow with each candle and stop when the day ends, so one day never ties into the next. By default only today's levels are shown; keep up to 50 previous days to compare.


Picture the session

Price opens, climbs and stalls at the first green line. Does it reject the level or accept it and keep going? You watch a level that matters, see how far the session has travelled and where it meets structure, VWAP, volume, support or resistance.


Type, instruments and timeframes

Chart overlay indicator for intraday support and resistance levels. It is designed mainly for cryptocurrencies on intraday charts, especially the 5-minute chart, and it also works on other markets such as stock indices. Intraday and daily charts are supported.


These levels are references, not automatic entries or exits. Trading involves risk. Past performance does not guarantee future results.


摘要

指标配置
指标分类
支撑与阻力
输出类型
可视化
数据要求
仅 K 线
支持的信号
触及水平位

讨论

客户评价

0.0
评价:0
客户评价
该产品尚无评价。已经试过了?抢先告诉其他人!

常见问答

Key Levels
Market Structure
Support & Resistance
cTrader Store 提供的所有产品,包括交易机器人、指标和插件,均由第三方开发者提供,仅供信息参考和技术访问之用。cTrader Store 并非经纪商,不提供投资建议、个人推荐或任何未来业绩保证。

该作者的其他作品

指标
RSI
Fibonacci
+1
Spot RSI divergences on your chart and get an entry, stop and six targets when your filters line up.
指标
Imbalance
Key Levels
+1
Keep open imbalance zones, untouched session highs and lows and the day's ADR range in view, without scrolling back.
指标
Key Levels
Support & Resistance
Add your provider's gamma levels by hand or automatically with our feed plugin, and see the gamma regime at a glance.
桌面插件
External Data
HTTP Requests
Load live gamma levels from your own QuantWheel API key into PulseFlow Gamma Regime, with no more typing by hand.

猜您喜欢

指标
SMC
Forex
+5
ICT liquidity engine for Gold: maps stop clusters, scores zones & projects the next target. Now with 4 ICT killzones.
指标
Prop
Forex
+13
🎯Automatically detects and visualizes classical chart patterns using multi-timeframe swing point analysis.
指标
BOS
MSS
+5
WinSMC is an overlay SMC indicator for cTrader. It helps you visually identify!
指标
Prop
Forex
+11
🌊 See when the market is truly in play. Tsunami measures Relative Volume by time-of-day 🌊
指标
SMC
NAS100
+5
Rolling Volume Profile MTF with 24H, 7D, 30D profiles and a precise NY Open marker.
指标
BOS
EMA
+5
VWAP Bands indicator with 3 standard deviation levels, buy/sell zones, and a draggable ON/OFF button to toggle the entir
指标
ADX
ATR
+2
GOLD SENTINEL v1.0 - A CANDLE-COLORING INDICATOR FOR GOLD.
指标
Drawdown Monitor
Protect your funded account. Real-time Daily Equity Drawdown monitor with Green / Orange / Red flashing alerts.
指标
Clean trend indicator using CCI & ATR. Highlights up/down trends with adaptive, no-repaint lines.
指标
AI
Prop
+7
EMA Clouds, Multi-Timeframe (MTF) Overlay, Swing High/Low detection, and a smart Dashboard with neutral zone filtering.
指标
ATR
RSI
+6
💹 Define a price channel 📈 and determine trend direction (bullish 🟢 or bearish 🔴).
指标
Prop
Forex
+5
Traders Panel: Scan 15 pairs across 5 timeframes. Live heatmap, strength rankings and best setups in one panel.
指标
Prop
Forex
+11
😎Read the description before purchasing💩
指标
ADX
ATR
+5
Configure, simulate, and analyze trading strategies with custom filters, multi-target exits, and detailed performance me
指标
Forex
Fibonacci
+2
Enhance your trading with customizable alerts and dynamic visual tools for trendlines, Fibonacci levels, and more.
指标
Forex
BTCUSD
+10
6-stage IIR filter trend indicator with colored line segments, reversal signals, alerts, and entry arrows.
指标
Forex
Customizable Dynamic Fibonacci Channels and Smart Alerts
指标
ATR
MSS
+5
Advanced market structure and institutional cycle mapper with visual reference cards and entry alerts

价格

注册日期 14/10/2026